Microsoft Edge (Chromium) Tools for VSCode now generally available
2 min. read
Published on
Read our disclosure page to find out how can you help MSPoweruser sustain the editorial team Read more


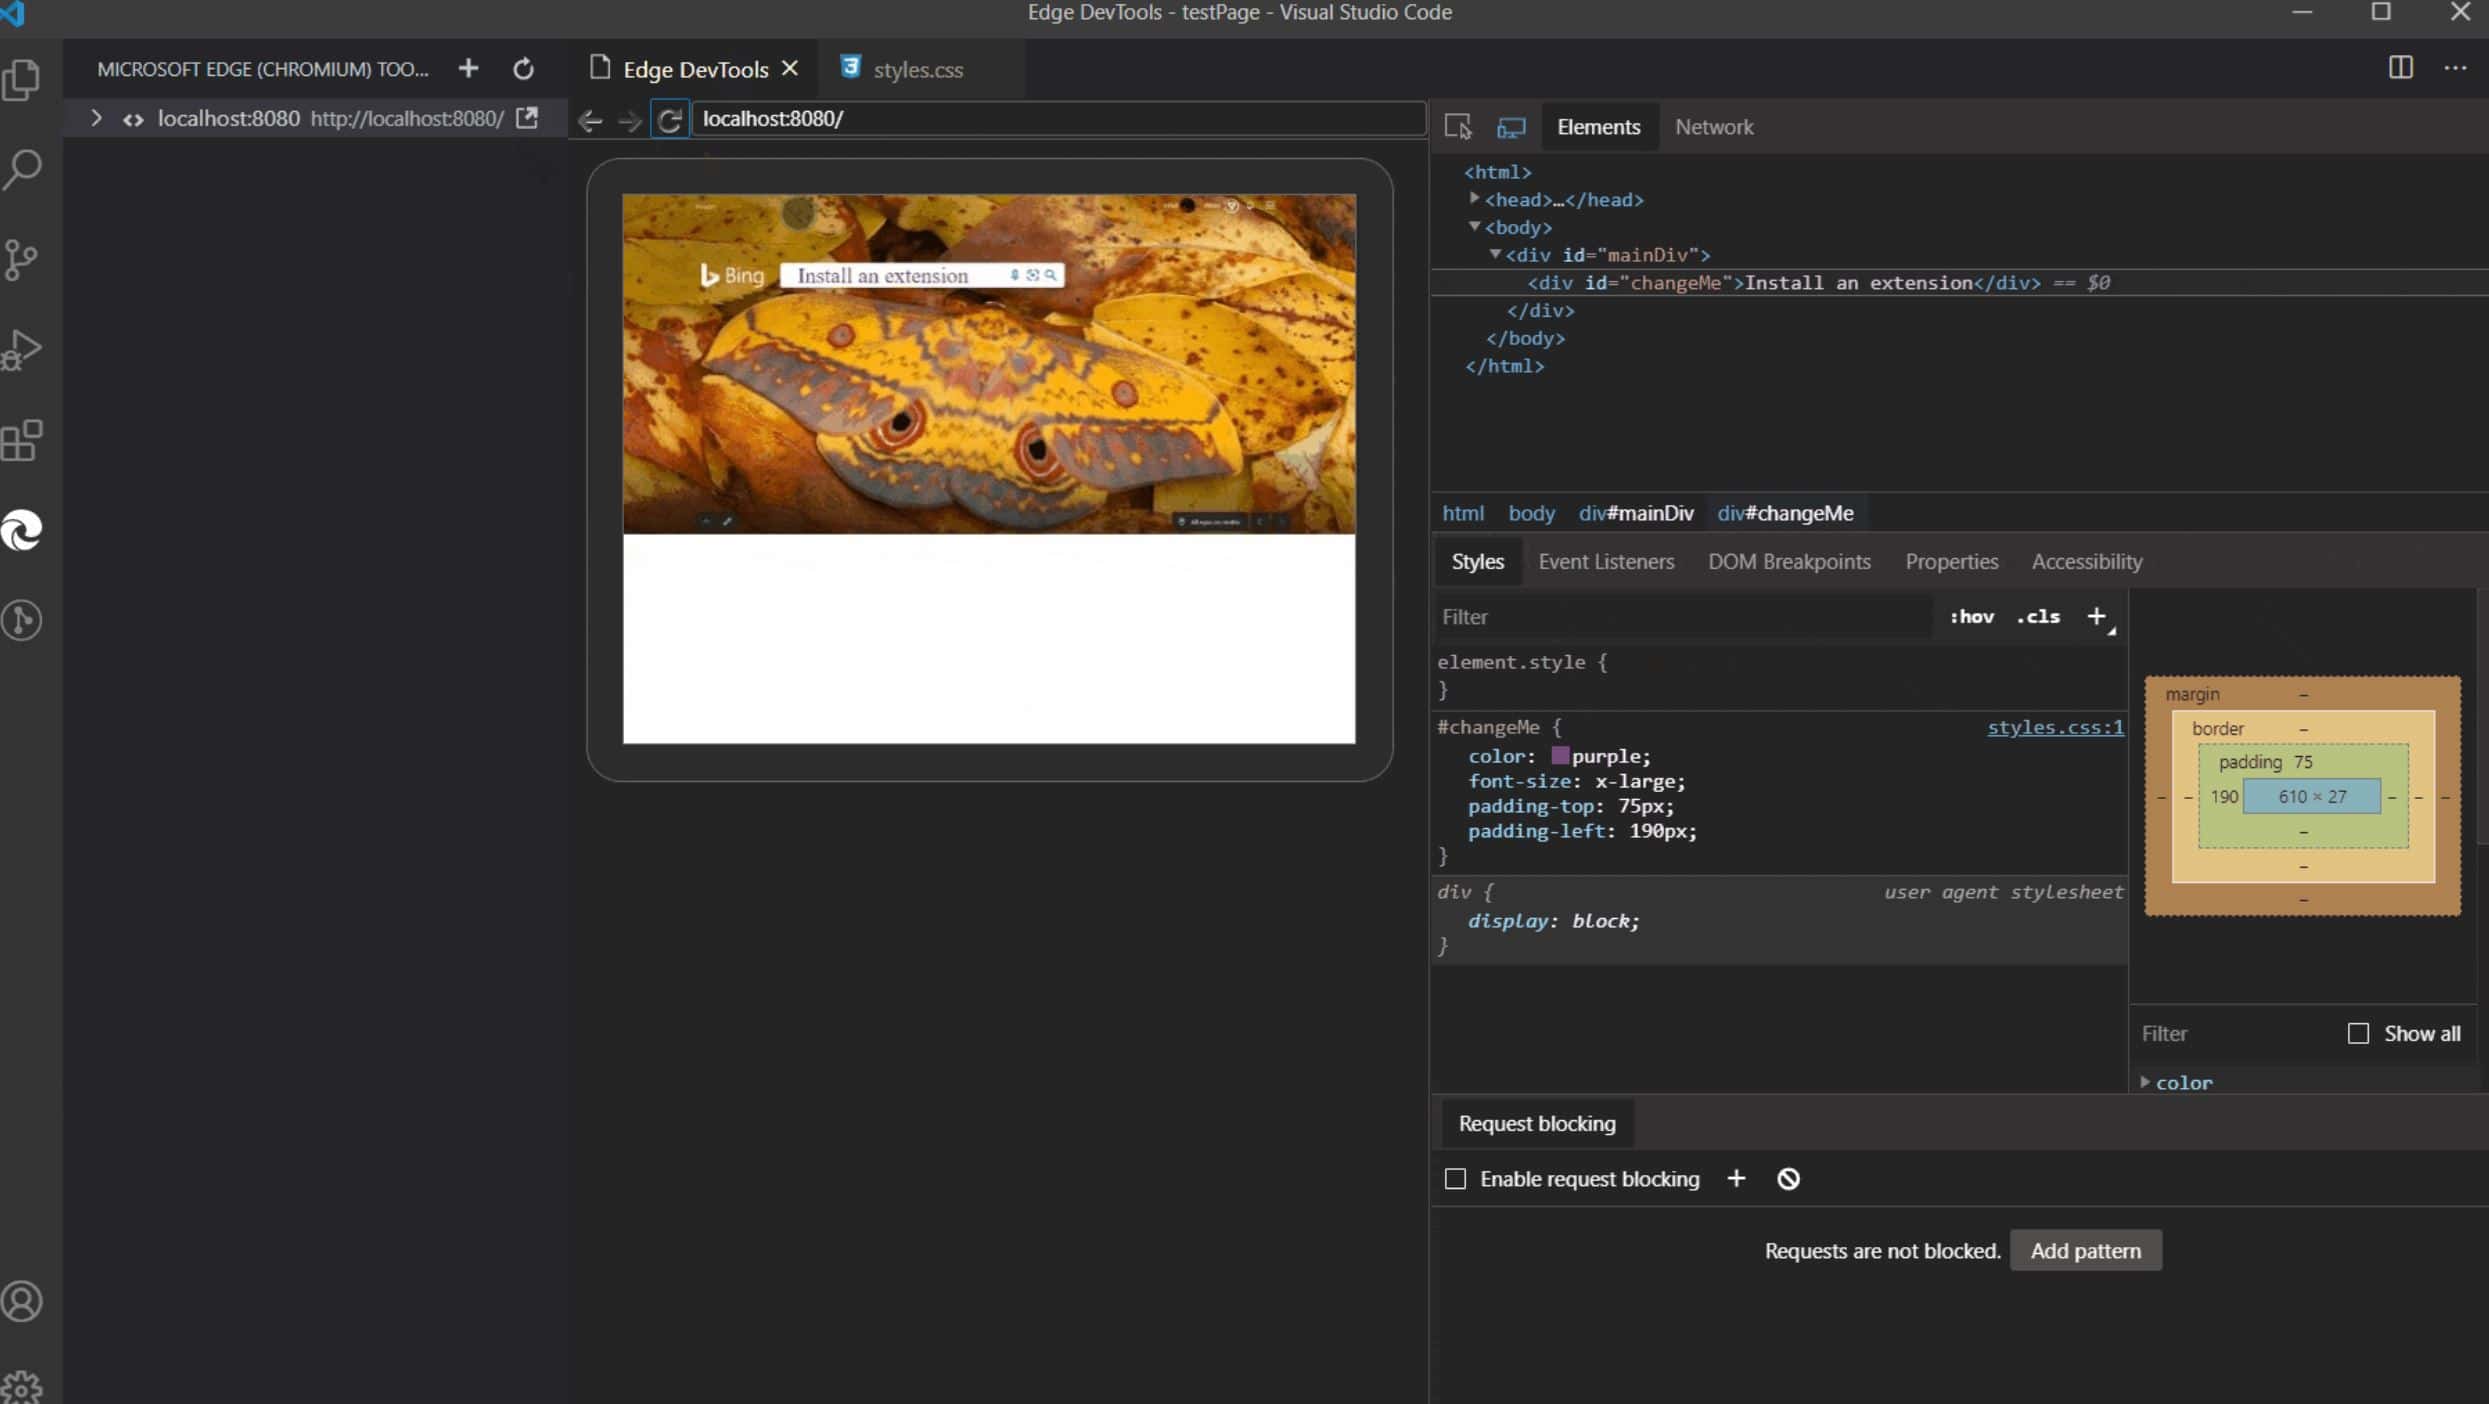
Microsoft today announced the general availability of the new Microsoft Edge Tools for VS Code extension. This extension will allow developers to use Edge browser’s Elements and Network tool from within the VS Code editor. The DevTools will connect to an instance of Microsoft Edge giving you the ability to see the runtime HTML structure, alter layout, fix styling issues, and view network requests without leaving VS Code.
“Continuously switching between editor and browser adds cognitive load to your workflow throughout the day. You change from one environment to another – from development to debugging mode – and you need to switch back. That feedback is what prompted us to explore embedding the developer tools into an extension, thus allowing you to see what your code generates and debug it without leaving your “development” mindset.” – Microsoft Edge team.
Microsoft Edge Tools for VS Code features:
- Debug configurations for launching Microsoft Edge browser in remote-debugging mode and auto attaching the tools,
- Side Bar view for listing all the debuggable targets, including tabs, extensions, service workers, etc.
- Fully featured Elements and Network tool with views for HTML, CSS, accessibility and more.
- Screen-casting feature to allow you to see your page without leaving VSCode.
- Go directly to the line/column for source files in your workspace when clicking on a link or CSS rule inside the Elements tool.
- Auto attach the Microsoft Edge Tools when you start debugging with the Debugger for Microsoft Edge extension.
You can download the new extension here.
Source: Microsoft


User forum
0 messages