Power BI Desktop June Update adds data bars to tables and matrices, new map themes and more
![]() 1 min. read
1 min. read
![]() Published on
Published on
Share this article

Improve this guide
Read our disclosure page to find out how can you help MSPoweruser sustain the editorial team Read more
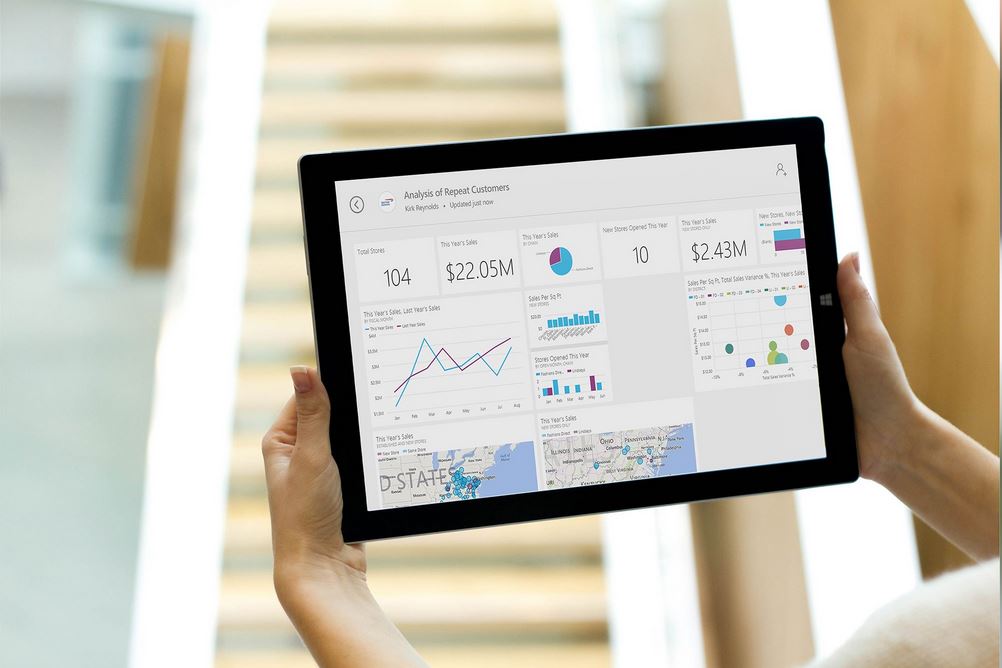
Along with the announcement about the general availability of Power BI Premium, Microsoft today announced the June Update for Power BI Desktop with several new new reporting features, new data connectors, accessibility features, and more. They have added data bars to tables and matrices, markers for line charts, new map themes, and a horizontal image slicer. Find the full list of new features coming in this update below.
Reporting:
- Data bars for new table & matrix (preview)
- Markers on line, area, & combo charts
- Accessible reports
- Consume Power BI reports with keyboard navigation and screen reader support
- Create accessible reports
- Visuals font family setting
- Horizontal Image Slicer
- Combo chart formatting updates
- Force zeros to align between the two axes
- Shade area of the line
- Bing maps improvements
- Map themes
- Improved geo hierarchy experience
- High density line sampling
Data connectivity:
- Custom Data Connectors support
- Power BI service Live Connect to On Premises and Push streaming datasets
- Impala connector is now generally available
- Amazon Redshift connector is now generally available
- SAP BW connector – DirectQuery support (beta)
- IBM Netezza connector (beta)
Query editing:
- “Add Column from Examples” enhancements
Read about these features in detail here.


User forum
0 messages