Power BI Desktop July Update includes custom visuals store integration and more
1 min. read
Published on
Read our disclosure page to find out how can you help MSPoweruser sustain the editorial team Read more

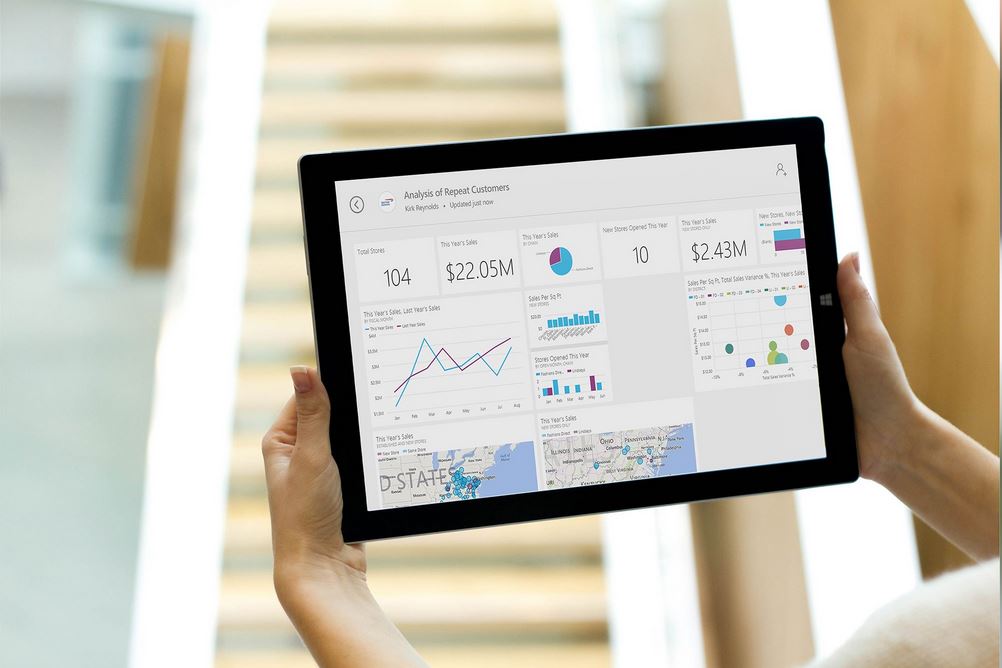
Microsoft today announced the July Update for Power BI Desktop with custom visuals store integration, general availability release of the table and matrix visuals, and more. Users can now can open the store, browse visuals and add them to their Desktop. This makes it much easier to find new visuals and use them in their reports.
Find the full list of new features coming in this update below.
Reporting:
- New table & matrix visuals are now generally available
- Renaming fields in visuals
- Custom visuals store integration
- Relative date filters
- Responsive layout for visuals (preview)
- New waterfall chart option – breakdown
- Custom visual updates
- Drilldown Choropleth
- Drilldown Cartogram
- Drilldown Player
- Certified custom visuals
Analytics & modeling:
- Quick measures from the community
- Star rating
- Concatenated list of values
- Bidirectional cross filtering for DirectQuery is now generally available
Data connectivity:
- Snowflake connector general availability
Query editing:
- Add Column from Examples enhancements
Read about these features in detail here.


User forum
0 messages