Microsoft will add graphing mode to Windows Calculator before August this year
Last year, Microsoft announced that it is open sourcing Windows Calculator app on GitHub under the MIT License. In March last year, Microsoft announced that it is working on new graphing features for Windows Calculator app. Today, Microsoft announced that graphing mode feature will be added to Windows Calculator app on every Windows 10 and 10S PCs before August this year. Right now, Windows Insiders can try out the new graphing mode preview in Windows Calculator app.
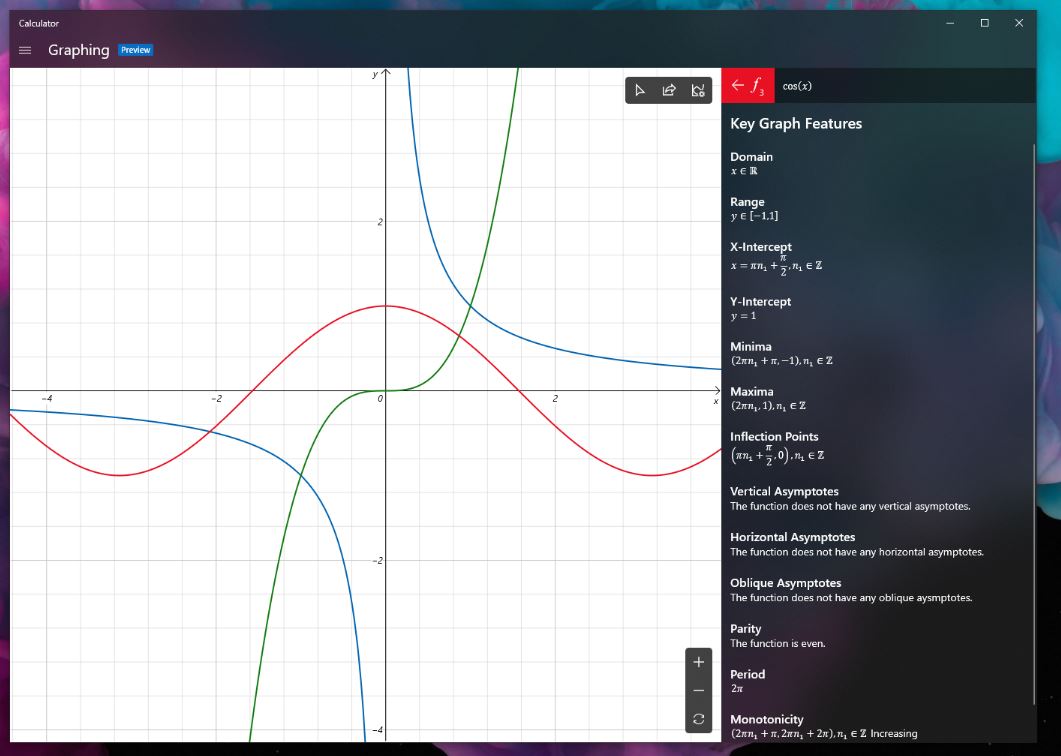
The new graphing mode feature will students users plot and analyze multiple equations and manipulate equation variables to help understand how changes to equations affect graphs.
With the new graphing mode feature in Calculator app,
- Users can enter an equation so that it can be viewed on the graph.
- Users can enter multiple equations so that they can compare plots against each other and see the interactions between the lines.
- Users can edit equations so that they can see how changes affect the plot and correct mistakes.
- Users can change the graph viewing window so that they can see different parts of the plot at different levels of detail.
- Users can change line visual options so that they can clearly differentiate between multiple plots.
- Users can export graphs so that they can share it with others or incorporate into Office/Teams.
- Users can easily manipulate secondary variables in equations so that they can quickly understand how changes to equations affect the graph.
- Users can see traceable key graph features (KGF) as nodes/dots on the equations, and summon other KGFs in a list so that they can better understand the important features of a given function.
- Users can trace plots so that they can better understand the relationship between variables in the equation on the graph.
Microsoft will also allow IT admins to disable this feature during assessments.
Source: Microsoft
Read our disclosure page to find out how can you help MSPoweruser sustain the editorial team Read more


Improve this guide


User forum
0 messages