Some statistics on smartphone usage in Europe
According to statistics published my Yahoo owned Flurry, there are some large differences in smartphone usage in the different countries across Europe. First of all there are some quite interesting differences in smartphone possession per capita.
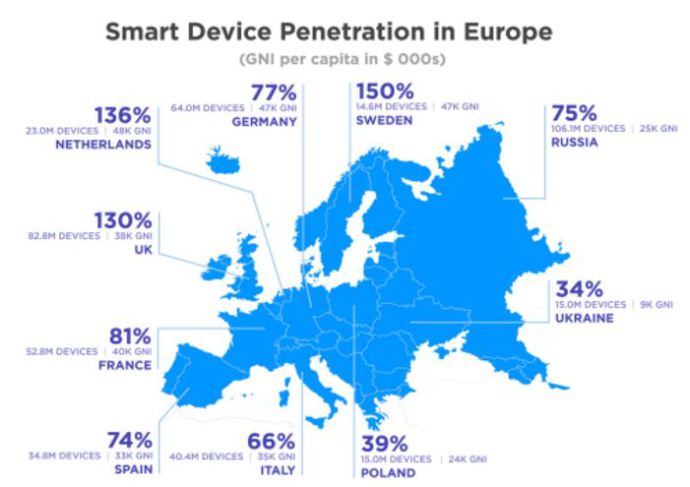
This graphic shows the amount of smartphones in relation to the number of residents of a country. Since the study was made for Europe it cannot be generalized to less well-off countries in general. However, overall there can be seen a relation between the GNI per capita (roughly speaking that is the value of possessions of a citizen of the respective country) and the amount of smartphones in possession. “Wealthier” countries such as the United Kingdom or the Netherlands have a ratio of smartphones to users over 100%, meaning a lot of people own more than one smartphone. “Poorer” countries like Poland or the Ukraine can barely reach a percentage of 40%.
As already stated, a direct relation between wealth and smartphone ownership cannot be seen in this graphic, however. That is due to two main factors. First of all, not all countries follow this kind of logic. In Germany for instance, Europe’s economically strongest country and one with the highest GNI per capita, only 77% of residents use smartphones. While France, Italy and Spain (81%, 66% and 74% respectively) playing in the economical midfield would show Germany being only an exception from the rule, Russia has a percentage of 75% while having a very low GNI per capita compared to Western Europe. Additionally the GNI per capita is not always a meaningful indicator for comparing wealth. For example one Euro would convert to about four Polish Zloty. Still, four Zloty might get you more than one Euro will. Without digging deeper into detail, I am just trying to say that you should take this with a large pinch of salt. Still, it is quite interesting to look at as it contains some good information.
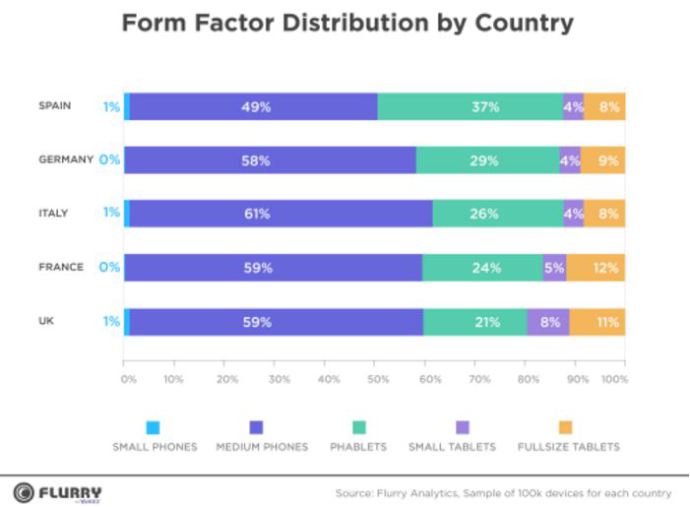
The second info graphic is a lot simpler. It represents the “form factor distribution by country”. Phablets are especially popular in Spain, whereas in the UK small tablets are more popular than in the other countries compared. Overall, on the other hand, the differences are not major.
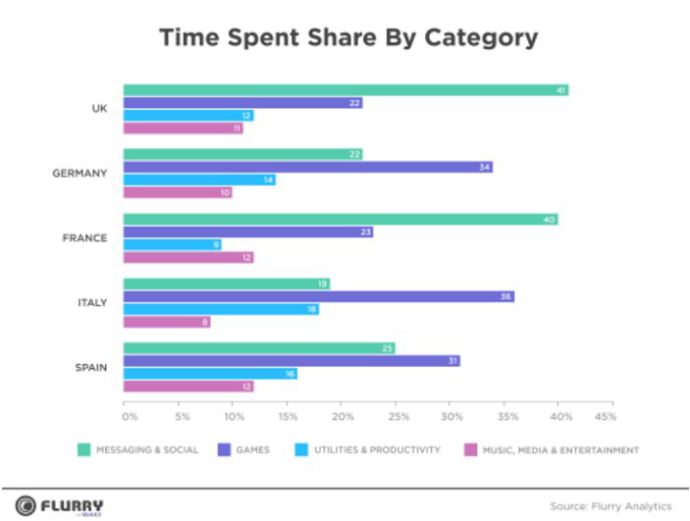
Lastly there are also statistics available about the content that smartphone users consume. Here some enormous differences can be seen. While the French and Britons use their phones mostly for social things and messaging, people from Italy or Germany tend to be more into Gaming. To me personally quite surprising is the fact that music and multimedia as well as productivity have a quite low attraction to smartphone users.
You can find the full study with all its statistics here.
Read our disclosure page to find out how can you help MSPoweruser sustain the editorial team Read more


Improve this guide

User forum
0 messages