Microsoft Excel’s new STOCKHISTORY function gives you access to historical stock data
![]() 1 min. read
1 min. read
![]() Published on
Published on
Share this article
Improve this guide
Read our disclosure page to find out how can you help MSPoweruser sustain the editorial team Read more
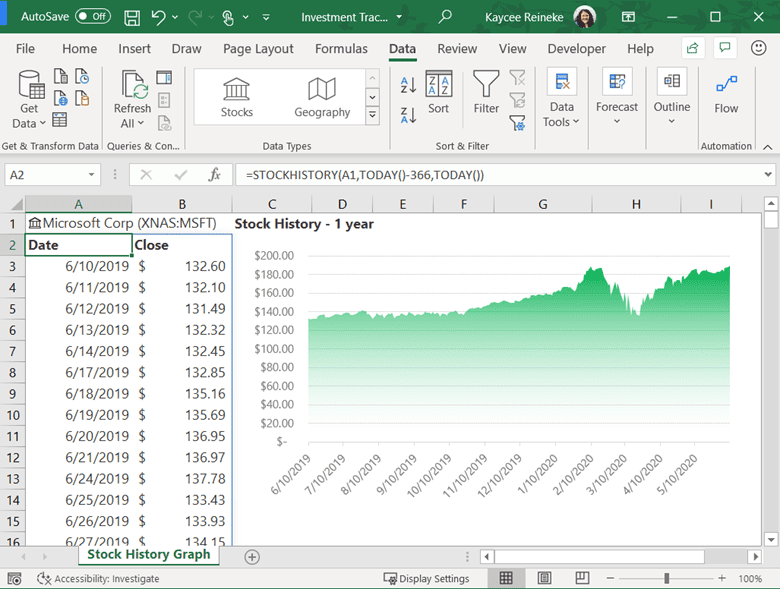
Last year, Microsoft introduced new Stocks data type in Excel. It allowed users to easily pull refreshable quotes for stocks, bonds, funds, and currency pairs inside Excel document. Apart from the current stock information, users might also need the history of a financial instrument. To solve this issue, Microsoft Excel is introducing a new function called STOCKHISTORY.
STOCKHISTORY function signature:
STOCKHISTORY(stock, start_date, [end_date],[interval],[headers], [property0], [property1] [property2], [property3], [property4], [property5])
- stock: The identifier for the financial instrument targeted. This can be a ticker symbol or a Stocks data type.
- start_date: The earliest date for which you want information.
- end_date (optional): The latest date for which you want information.
- interval (optional): Daily (0), Weekly (1), or Monthly (2) interval options for data
- headers (optional): Specifies if additional header rows are returned with the array.
- property0 – property5 (optional): Specifies which information should be included in the result, Date (0), Close (1), Open (2), High (3), Low (4), Volume (5).
Microsoft is using the historical data from Refinitiv for this function. STOCKHISTORY feature is now available to half of Microsoft 365 Subscribers in the Beta level of the Office Insider program.
Source: Microsoft


User forum
0 messages