60 iPhone Statistics for 2025: Usage, Sales & Market Share
21 min. read
Updated on
Since the original iPhone burst onto the scene in 2007, Apple has gripped the smartphone market, with Android as its only rival to beat.
These epic iPhone statistics look at the current and historical data surrounding usage, market share, apps, and demographics.
Gain more insight into the iPhone than ever before!
Key iPhone Statistics
Just how popular is iPhone and what is its market share? These are the key iPhone statistics everyone should know.
- As of 2023, there are over 1.5 billion active iPhone users across the globe.
- There are more than 124 million iPhone users in the United States.
- With a 21% share, iPhone is second in the global smartphone market in 2023.
- Apple made $51.3 billion in iPhone sales for Q2 2023.
- There were 8.6 billion iOS app downloads in Q1 2023 and 32.6 billion in the whole of 2022.
iPhone Usage Statistics
How many people across the world have an iPhone and how do they use it? Find this out with other interesting usage stats below.
1. As of 2023, there are over 1.5 billion active iPhone users across the globe.
(Sources: World Population Review, The Verge)
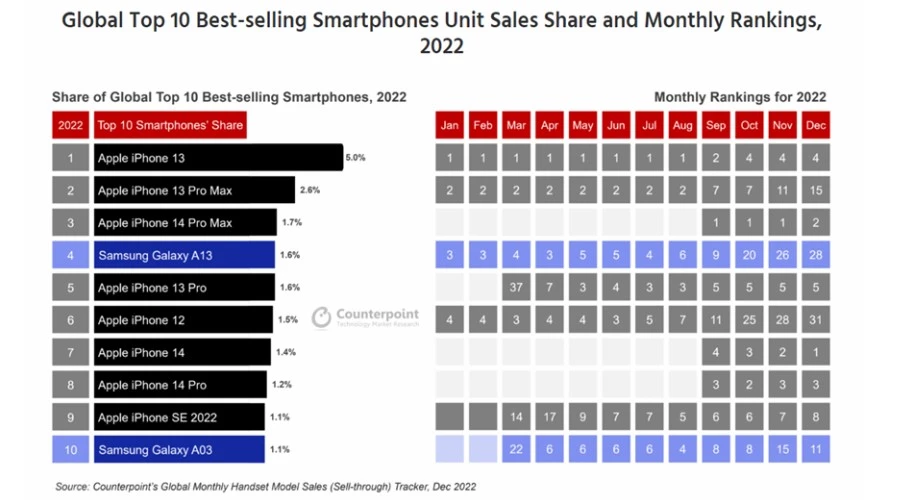
With more than 1.5 billion active users (not just sales), iPhone is the most popular single smartphone brand in the world. It also makes up a huge chunk of all Apple users, which surpassed 2 billion at the start of the year.
The number of iPhone users has steadily grown since its launch in 2007 and it surpassed 1 billion users in 2020.
2. There are more than 124 million iPhone users in the United States.
(Source: Statista – iPhone Users US)
Based on the latest available data from 2022, there were 124.7 million active iPhone users in the United States alone. This steady rise in users was attributed to price reductions on older models and consistently successful new releases.
3. China has the most iPhone users in the world.
(Source: QZ)
You might assume the United States as the birthplace of the iPhone would have the most iPhone users. However, due to its sheer population size, China actually comes out on top.
To put it into perspective, the last time a concrete number was released was 2016. Back then, China had over 130 million iPhone users, which is more than the US has currently.
However, as a percentage of the smartphone population (per capita), China still has more Android users than iPhone users. Check below for iPhone market share by country.
4. In its first year, iPhone had more than 10 million active users.
(Source: Statista – Active iPhone Users)
The original iPhone was released in June 2007 and by 2008 it had more than 10 million users, which was a huge feat at the time and popularity only snowballed with each new iPhone release. Overall, there was growth of approximately 14,900% from 2008 to 2023.
5. iPhone users spend a full working week on their phones every week.
(Source: Solitaired)
If the average work week is 40 hours, then iPhone users spend just as much time on their phones as they do working. Data taken from 667 iPhone users over 5 days found they were active for 39 hours and 54 minutes. Of course, this includes time spent on the device while at work, but it’s an incredible amount of time to be staring at a screen.
6. 72% of all iPhones are running iOS 16.
(Source: 9to5Mac – iOS Usage)
Apple recently shared data about its iOS operating system and completed iPhone updates. 92% of all iPhones are using the latest iOS 16 (72%) or previous iOS 15 (20%). This jumps to 96% when only counting iPhones released in the past 4 years.
Apple is much more effective at keeping its users up to date, but that’s because it has more control over handsets than Android, which has to work with different smartphone makers from Samsung on down.
7. The average lifespan of an iPhone is just over 4 years.
(Source: Asymco)
Based on the number of devices sold versus the number of active devices in use, it’s believed the average lifespan of an iPhone is four years and three months. Even if their device lasts longer, most people upgrade anyway.
8. Approximately 88% of Apple product owners have an iPhone.
(Source: 9to5Mac – Apple Ownership)
The iPhone is the most popular product made by Apple. 88% of Apple customers own one, followed by 73% for the iPad, 58% for the Apple Watch, and 50% for Mac computers and laptops.
Furthermore, 60% of Apple customers own three or four devices. Of those that own just one Apple device, 59% own an iPhone. Apple users are some of the most loyal in the tech market.
9. Apple’s kill switch feature reduced iPhone theft by up to 50%.
(Source: TechCrunch – iPhone Theft)
The iPhone kill switch is a security feature introduced in 2014 that prevents a stolen device from being used by anyone other than the original owner. In the 12 months that followed, iPhone theft decreased by 50% in London, 40% in San Francisco, and 25% in New York. Android soon introduced similar features.
iPhone Sales Statistics
While iPhone sales are less than Android, Apple has the benefit of owning all iPhone devices and the iOS operating system.
10. Apple sold 225 million individual iPhones in 2022.
(Sources: Statista – iPhone Revenue, Business of Apps – iPhone)
As far as individual units, Apple went from selling 55.8 million in 2010 to roughly 225 million in 2022. In 2022, this generated revenue of $205.4 billion.
11. Approximately 2.32 billion iPhones have been sold since launch.
(Sources: Business of Apps)
Since its inception, Apple has sold approximately 2.32 billion iPhone units across all models. Its biggest year was 2021 when 242 million iPhones were sold. This topped its previous highest year of 231.2 million in 2015.
12. Apple made $51.3 billion in iPhone sales for Q2 2023.
(Source: Fortune)
In the second quarter of 2023, iPhone sales netted Apple $51.3 billion, which is a 1.5% increase from the same time last year. This was seen as a rebound for the iPhone 14, which had been struggling due to COVID restrictions in China last year that prevented new shipments.
13. Only a quarter of US iPhones are sold directly through Apple.
(Source: CIRP – iPhone Sellers)
Only 24% of the iPhones sold in the United States are directly from Apple. The majority are purchased through wireless carriers (67%), such as AT&T, Verizon, and T-Mobile, which now promote iPhone giveaways each year.
Retailers like Best Buy (4%) and others (5%) manage to capture some sales over the official Apple Store. There is also a second-hand market not included in these stats.
14. 80% of the refurbished smartphone market is iPhones.
(Source: CCS Insight)
The long-term value of the iPhone allows it to command a 14% higher selling price in the refurbishment market than in the standard second-hand economy. More than 80% of refurbished smartphones are iPhones.
Android and other handsets have less resale value and are often disposed of or given to family members.
iPhone Sales Statistics by Model
The latest flagship iPhone model always gets a surge in sales, but other models including older versions continue to sell too.
15. The iPhone 14 Pro Max is currently the highest-selling model.
(Source: Apple Insider – iPhone 14)
It stands to reason that the current-gen iPhone range is the highest-selling. This crop is led by the iPhone 14 Pro Max with a 19% share as of February 2023. The standard iPhone 14 is second with 18%, and the iPhone 14 Pro is third with 13%. The lowest-selling iPhone 14 is the Plus with 7%.
16. iPhones take the top 4 spots in the 15 bestselling premium smartphones chart.
(Source: GSM Arena)
For those that like a bit of luxury from their smartphone, you’re looking at spending at least $500. In this premium market, iPhone models take the top 4 spots in sales volume for Q1 2023.
It’s topped by the iPhone 14 Pro Max, 14 Pro, 14, and iPhone 13. Furthermore, the iPhone 14 Plus takes the 6th spot and the iPhone 12 takes the 8th position.
Samsung also has 6 positions, topping out at 5th with the Galaxy S23 Ultra.
17. The iPhone 13 was the best-selling smartphone of 2022.
(Source: CounterPoint – Smartphones 2022)
The iPhone 13 dominated the smartphone sales charts in 2022 and made up 28% of all iPhone sales. It was number 1 in the US, UK, China, Germany, and France, and it held the sales top spot each month from its launch in September 2021 until August 2022, when the iPhone 14 Pro Max took the lead.
18. Apple’s iPhone 6 and 6 Plus were the biggest-selling iPhone models in history.
(Source: Apple Must)
Representing a sleeker design with a larger display than its predecessors, the iPhone 6 and 6 Plus has sold approximately 222.4 million units since its launch in 2014. This also gives it the crown of biggest selling smartphone in history.
Data suggests both the iPhone 12 and 13 could break this record in the coming months.
19. The very first iPhone is the poorest-selling model of all time.
(Source: Mac Rumors)
There have been 38 different iPhone models, but it’s the very first model released in 2007 that sold the least number of units. This isn’t surprising since it was the testing ground for all future iPhones.
The second poorest-selling model is the iPhone 12 Mini, which was pulled from production within just a year of launch in October 2020 due to poor sales. It seems there is no longer interest in small smartphones.
iPhone Market Share Statistics
The long-running war has always been iPhone vs Samsung and iOS vs Android. Here’s what the data says and where the other competitors rank.
iPhone Market Share Worldwide
Worldwide market share looks at how iPhone is doing compared to all its other competitors on a global basis.
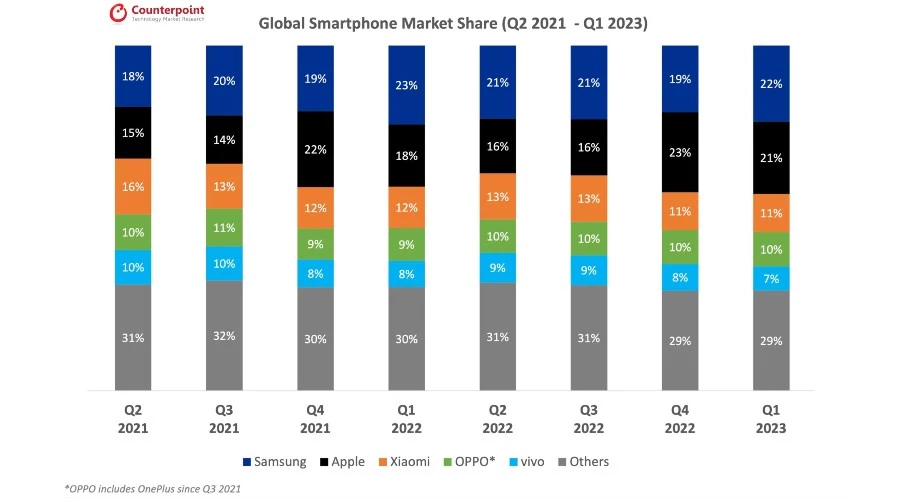
20. With a 21% share, iPhone is second in the global smartphone market in 2023.
(Source: CounterPoint – Smartphone Share)
When looking solely at handsets, iPhone is the second most popular smartphone in the world with a 21% market share as of Q1 2023. It was just beaten by rival Samsung (22%). Xiaomi came in third with 11%.
The last times iPhone beat Samsung was the fourth quarter of 2022 (23%/19%) and the fourth quarter of 2021 (22%/19%).
21. Global iPhone market share was 18% in 2022.
(Source: CounterPoint – iPhone Share)
The iPhone held 18% of the global smartphone market in 2022, losing out to Samsung with 21%. Xiaomi came in third with roughly a 12% share of the market.
The only other years iPhone managed 18% was consecutive years in 2011 and 2012.
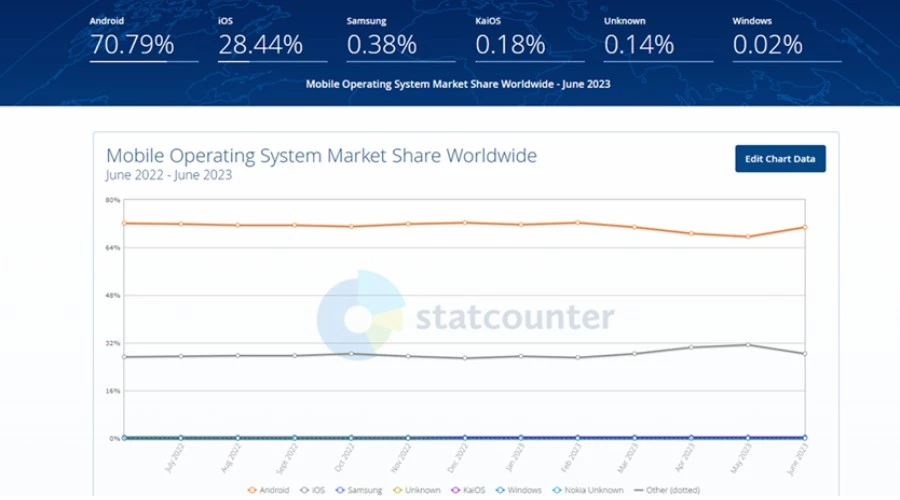
22. The iPhone holds a 28.44% share of the mobile operating system market, as of June 2023.
(Source: StatCounter – Mobile)
These stats focus solely on iPhones (not other devices using iOS) and only Android mobile devices (not tablets or smart TVs). The data shows Android comes out on top with a 70.79% market share, compared to iPhone’s 28.44%.
Samsung is a distant third with 0.38%, followed by KaiOS (0.18%). Windows phones barely register with just 0.02%.
23. iOS is closer to Android when all devices are accounted for.
(Source: StatCounter – OS)
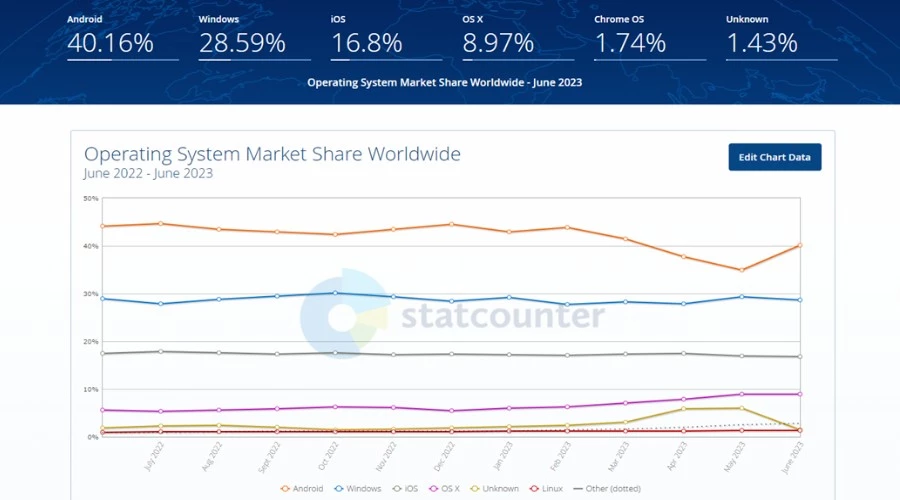
If we ignore the iPhone specifically and count all devices that use iOS and other mobile operating systems, Android has 40.16% of the pie and iOS has 16.8%.
This closes the gap between the two. In fact, when only looking at tablets, iOS has 53.55% to Android’s 46.27%.
24. Apple was the only leading vendor to increase market share in Q1 2023.
(Source: Canalys)
In the first quarter of 2023, worldwide smartphone sales dropped 13% from this time last year. Apple was the only vendor in the top 5 of sales to increase its market share for this period.
iPhone rose 3% from 18% to 21%, whereas rival Samsung dropped 2% from 24% to 22%.
iPhone Market Share by Country
These iPhone statistics explore the market share of different countries and other interesting regional data.
25. North Korea has the most iPhone users per capita.
(Source: World Population Review)
As of January 2023, 99.4% of all smartphones in North Korea are iPhones. What’s most interesting about this figure is the device itself is actually banned from sale within the country. However, the public believes it is more secure from state spying, which has created a huge black market.
26. iPhone market share in Japan is twice as large as Android.
(Sources: StatCounter – Japan, Apple insider)
Japan has always been iPhone country and despite declining sales, iOS devices still lead market share with 67.75% compared to Android’s 32.12% (June 2023).
In 2022, 34.3 million smartphones were sold in Japan. 16.6 million of those were iPhones. In the fourth quarter, the battle was close. Apple sold 4.4 million iPhones (51.2%), while Android sold 4.1 million units.
27. iPhone market share in China has grown to 20%.
(Sources: CounterPoint, GizChina)
Collectively, there are still more Android smartphones in China than iPhones. However, with a 20% share of the market (Q1 2023), iPhone is the single most popular handset. China’s proprietary Android OPPO handsets are second with 18%, followed by Honor and Vivo (both 16%).
What’s most interesting about iPhone’s market share is it commands 80% of all smartphone profits due to its high price per handset.
28. With 57%, iPhone market share in Canada beats all Androids.
(Source: Statista – Canada)
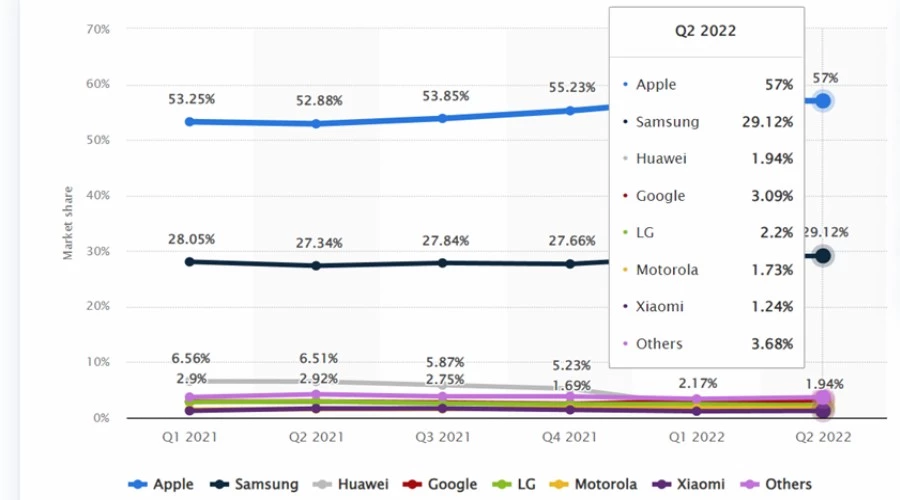
Canada is one of the few countries where iPhone dominates Samsung and every other Android smartphone combined. It held this position for the entirety of 2021 and into the first quarter of 2022, where it held 57% of the smartphone market.
Samsung had 29.12%, while all other handsets combined to less than 10% of the market.
29. In Australia iPhone market share dominates with 49.4% of the pie.
(Source: IDC)
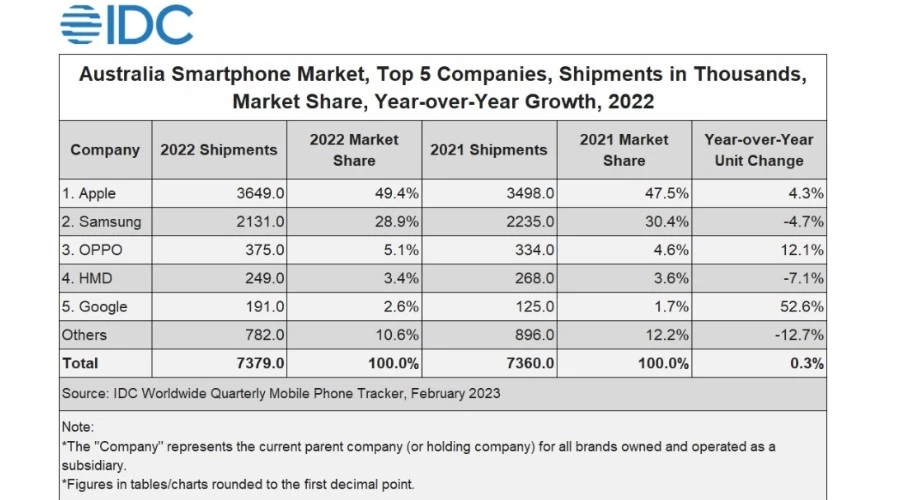
In 2022, iPhone represented 49.4% of the smartphone market in Australia, with Samsung trailing behind with 28.9%. This was 1.9% increase for iPhone from the previous year and amounted to 3.649 million units sold.
30. iPhone market share in the UK has reached 51.63%.
(Source: World Population Review)
It’s a close but decisive win for iPhone in the UK with a 51.63% to 47.80% victory over Android handsets. Other smartphones make up just 3.83% of the market.
In neighboring Ireland, the number swing the other way with 51.49%/48.07% in favor of Android.
31. Android has a higher market share than iPhone in Germany.
(Source: World Population Review)
In Germany, the split is 59.79% vs 37.67% in favor of Android smartphones, which the public feel is better value for money.
iPhone Apps Statistics
These iPhone statistics look at the current and historically most popular apps and other interesting app-based data.
32. There were 8.6 billion iOS app downloads in Q1 2023 and 32.6 billion in the whole of 2022.
(Source: Business of Apps – Apps)
In the first quarter of 2023, there were 8.6 billion apps downloaded on iOS devices like the iPhone. This is the highest quarter in history other than during the first two-quarters of the COVID pandemic in 2020.
2022 saw the greatest number of iOS app downloads in history, totaling 32.6 billion. 2020 was the second-highest year with 34.4 billion app downloads.
33. Threads is the most popular free iPhone app in July 2023.
(Source: App Store)
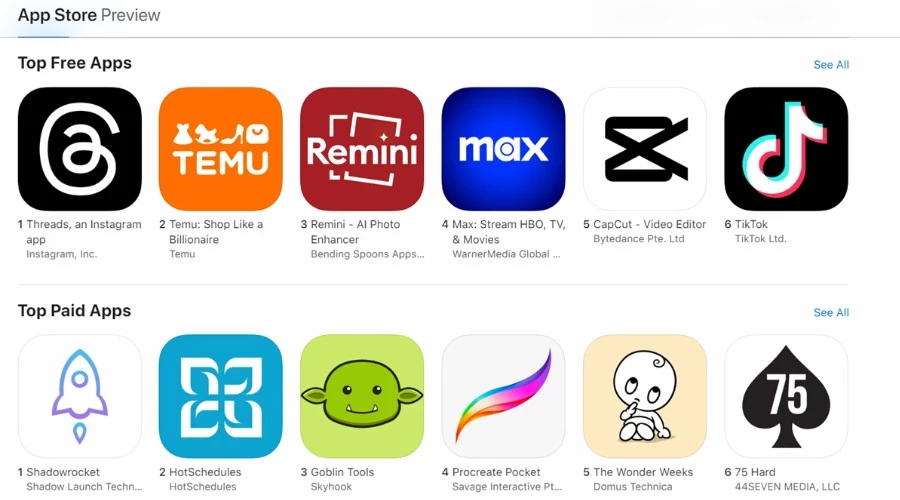
As of July 09, 2023, the new Instagram social media platform Threads is ranked the most popular free iPhone app on the official Apple App Store. It’s followed by shopping app Temu, AI photo enhancer Remini, and streaming service HBO Max.
In 5th is video editor CapCut, and 6th in the rankings is long-running favorite TikTok.
34. Shadowrocket is the most popular paid iPhone app in July 2023.
(Source: App Store)
As of July 09, 2023, the internet proxy tool Shadowrocket is ranked the most popular paid iPhone app on the official Apple App Store. It’s followed by employee scheduling app HotSchedule, cloud syncing app Goblin Tools, and the sketch and painting suite Procreate Pocket.
In 5th is baby app The Wonder Weeks, and 6th in the rankings is stargazing tool SkyView.
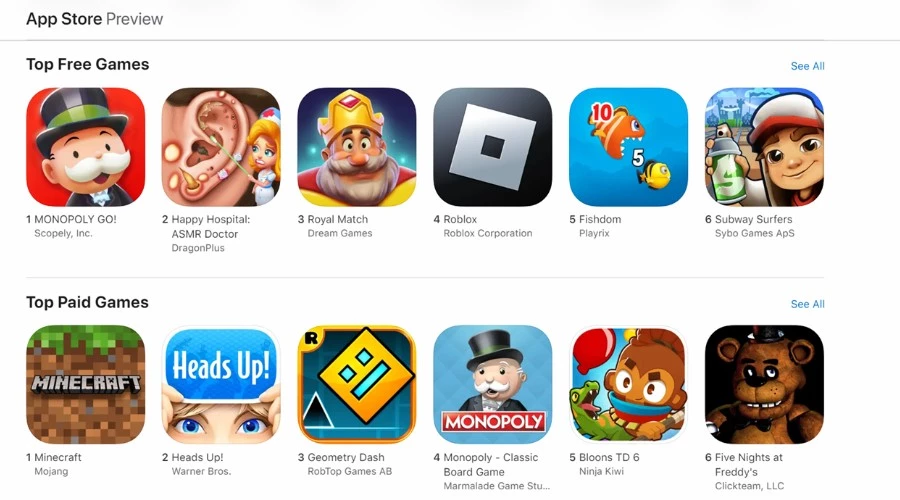
35. MONOPOLY GO! Is the most popular free iPhone game in July 2023.
(Source: App Store)
As of July 09, 2023, a digital rendition of the board game classic Monopoly is ranked the most popular free iPhone game on the official Apple App Store. It’s followed by Happy Hospital, Roblox, Royal Match, Fishdom, and Subway Surfers.
36. Minecraft is the most popular paid iPhone game in July 2023.
(Source: App Store)
As of July 09, 2023, cross-platform juggernaut Minecraft is ranked the most popular paid iPhone game on the official Apple App Store. It’s followed by Warner Bros’ Heads Up!, Geometry Dash, Monopoly Classic, Bloons TD 6, and everyone’s favorite horror Five Nights At Freddy’s.
37. TikTok was the most downloaded iPhone app of 2022.
(Source: The Daily Star)
Based on official Apple figures for 2022, TikTok was the most downloaded iPhone app. This was followed by YouTube, WhatsApp, Instagram, and Google Maps.
Although Apple does not release precise download numbers, TokTok has over 15 million ratings left on the App Store, and only a tiny percentage of overall users leave a rating.
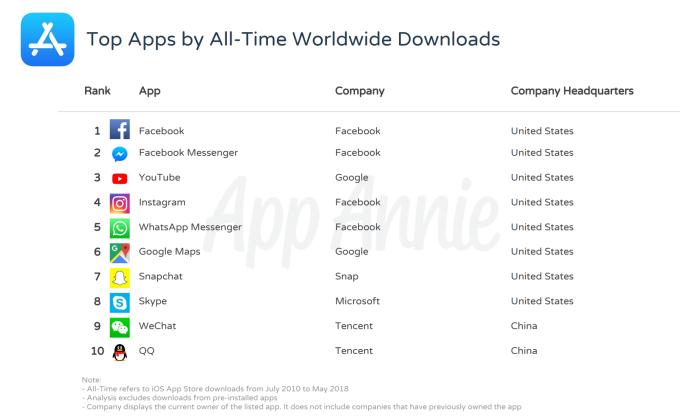
38. Facebook is the most popular iOS app of all time.
(Source: TechCrunch – Apps)
The last big research on all-time app usage was in 2018, which means newer apps like TikTok aren’t fairly represented. Nonetheless, Facebook topped the charts with 700 million downloads worldwide between July 2010 and May 2018.
It was followed by Messenger, YouTube, Instagram, and WhatsApp.
39. iOS users have spent the most on Netflix.
(Source: TechCrunch – Apps)
Based on the total amount of consumer spending, Netflix has been the most financially lucrative iOS app of all time (up to 2018) with close to $1 billion in revenue. This is followed by Spotify, Pandora Radio, Tencent Video, and dating app Tinder.
40. Candy Crush is the most successful game on iPhone of all time.
(Source: TechCrunch – Apps)
Based on data up to 2018, Candy Crush dominated the iOS gaming charts as the top free game and with the second most spent on in-app purchases. It was followed by Subway Surfers, Fruit Ninja, Clash of Clans, and Honour Kings.
Clash of Clans had more spent in-app than any other game.
iPhone Shipment Statistics
Shipments are the units sent from the manufacturing site to Apple warehouses, stores, and other retailers. These iPhone statistics explore shipments rather than actual sales.
41. Apple shipped over 55 million iPhones in Q1 2023.
(Source: Statista – Shipments)
More than 55 million units were shipped during the first quarter of 2023, which is a drop of twenty million since the last quarter of 2022. This is somewhat expected as Apple always does well in the fourth quarter of the year, especially around the holidays.
42. Apple shipped 224.7 million iPhones in 2022.
(Source: CounterPoint – iPhone 2022)
2022 was the iPhone’s third most successful year, with 224.7 million units shipped worldwide. This was down from its most successful year 2021, which saw 237.9 shipments. The second most successful year for iPhone was 231.50 shipments in 2015.
43. 2019 was iPhone’s worst year for shipments since 2014.
(Source: CounterPoint – iPhone 2022)
2019 was a particularly bad year for iPhone, shipping only 195.6 million units worldwide. To date and in the four years prior, shipments have never dropped below 200 million. This was blamed on battery replacement programs and rising prices causing fewer people to upgrade.
44. Shipments of iPhones made in India rose 65% in 2022.
(Source: CounterPoint – India)
India is now the main manufacturing location for iPhone outside of China. Data for 2022 shows a 65% rise in the volume of shipments out of India, which resulted in a 162% increase in value.
This was 25% of the value of India’s total smartphone shipments, up from 12% in 2021.
45. 85% of iPhone shipments come from China.
(Source: Tech Wire Asia)
The vast majority of iPhones are still manufactured and shipped from China, where Apple partner Foxconn operates ‘iPhone cities’ in Zhengzhou and other areas. The main site employs hundreds of thousands of workers, many of whom live at the facility.
46. COVID-19 caused iPhone shipment delays and supply problems.
(Source: BBC News)
Due to renewed government COVID restrictions in China, Apple had to delay shipments of its iPhone 14 range in the last quarter of 2022. It still managed to a higher market share than Samsung during this period.
iPhone Demographic Statistics
These demographic stats give further insight into who uses the iPhone.
47. More people aged 25 to 34 own an iPhone than any other age bracket.
(Source: CIRP – Ages)
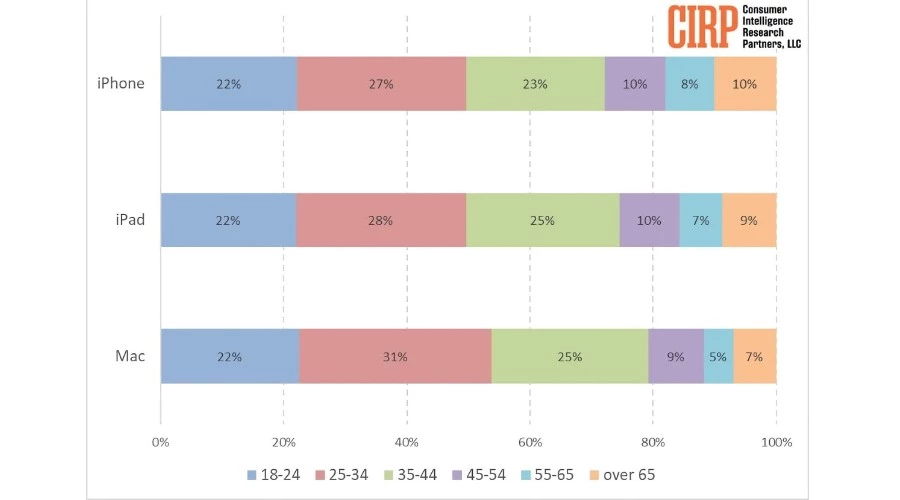
Recent data shows that 25- to 34-year-olds account for 27% of iPhone users. The second most popular age bracket is 35-44 (23%), closely followed by 18 to 24s (22%).
The least common age group to own an iPhone is 55 to 65 (8%). Interestingly, over 65s are more represented, at 10%.
48. More women own iPhones than men.
(Source: Statista – Gender)
The gender of iPhone users skews slightly female with 51% identifying as female, 46% male, and the remaining 6% not revealing their gender.
49. In 2022, more men prefer the iPhone Pro and Pro Max models than women.
(Source: CIRP – Gender)
Based on customers who purchased a new iPhone in 2022, 41% of men went for the iPhone 13/14 Pro or Pro Max models, compared to 33% of females, who were more likely to choose other models.
50. Of all smartphone users in the United States, 49.9% use the iPhone.
(Source: Statista – Population)
The percentage of smartphone users in the United States who own an Apple iPhone is 49.9%. This is more than twice the global iPhone user market share of around 18.55%.
iPhone vs Android Statistics
These top iPhone vs Android stats will only add fuel to the fire. Which do you prefer?
51. iPhone users earn $16,000+ more than Android users.
(Source: SlickDeals)
The iPhone certainly has a higher price point and this may be reflected in its userbase. According to a 2018 survey, those that choose iPhones earn an average annual income of $53,231 compared to Android users, who average $37,040 each year.
52. More 16–24-year-olds prefer iPhone to Android.
(Source: Statista – Age)
The only age bracket that iPhone beats Android in is 16 to 24, showing that younger people prefer iPhone.
53. More people jump from iPhone to Android than vice versa.
(Source: CIRP – Retention)
Android has a 91% customer retention rate, while iOS is 86%. This means Android users are more loyal and more iPhone users switch allegiances.
54. People believe iPhone is more secure than Android.
(Source: Beyond Identity)
A 2022 survey found that iPhone users reported feeling more secure than Android users. This was based on a number of factors, such as app security and cloud storage security. In a head-to-head comparison, 32% said they felt most secure using the iPhone 13 Pro Max compared to 13% using the Samsung Galaxy S22 Ultra.
Furthermore, 75% of iPhone users were able to fully recover their data after a security breach compared to 55% of Android users.
55. Apple’s App Store nearly doubles the revenue of Google Play.
(Source: Statista – App Stores)
In 2021, the Apple App Store generated $85.1 billion compared to Google Play’s $48 billion, despite more people using Google Play. This may be because iPhone is more popular in countries with higher incomes, such as the United States and Japan.
56. iPhone users spend $0.53 more than Android users on in-app purchases.
(Source: Statista – App Spend)
In 2022, the average in-app spend per person, per app for iOS users is $1, while Android users spend $0.47.
57. Android accounts for 65% of mobile web traffic.
(Source: Insider Intelligence – Traffic)
Android dominates smartphone web traffic share with 65% compared to iPhone’s 35%. The only continent where more iPhone users browse the mobile web is Oceana, where the split is 59% iPhone to 41% Android.
In Africa and South America, web browsing using iPhone is much less common, with Android holding an 80% share to iOS’s 20%.
58. Android users are 1.2% more responsive to push notifications than iPhone users.
(Source: AirShip)
Apps on Android perform better than iPhone apps in response to push notifications. The response rate for Android is 4.6% compared to 3.4% for iPhone. This means iPhone users are less likely to tap on their push notifications than Android users.
Android users are more likely also opt-in to receiving push notifications (86%), compared to iPhone (51%).
59. The Samsung Galaxy S23 Ultra has a more powerful battery but the iPhone 14 Pro Max lasts longer.
(Source: 9to5Mac – Batteries)
As always, many comparisons are being made between the latest flagships – this time the iPhone 14 Pro Max and Samsung Galaxy S23 Ultra.
Yes, the S23 Ultra has a more powerful 5,000 mAh battery compared to Apple’s 4,323 mAh offering. However, testing shows the iPhone 14 Pro Max lasts 38 minutes longer.
This is because Apple is able to fine-tune everything inside. Overall, it lasted 27 hours and 44 minutes.
60. iPhone is less than five months older than Android
(Source: Apple Insider – Anniversary)
The iPhone recently celebrated its 16th birthday, having launched on June 28, 2007. It beat Android to market by less than four months, as it entered its public beta phase in November 2007.
Conclusion
These iPhone statistics reveal a strong market share and loyal user base that will cement it as one of the most popular smartphone brands in the world for years to come.
Sources
- World Population Review
- The Verge
- Statista – iPhone Users US
- QZ
- Statista – Active iPhone Users
- Solitaired
- 9to5Mac – iOS Usage
- Asymco
- 9to5Mac – Apple Ownership
- TechCrunch – iPhone Theft
- Statista – iPhone Revenue
- Business of Apps – iPhone
- Fortune
- CIRP – iPhone Sellers
- CCS Insight
- Apple Insider
- GSM Arena
- CounterPoint
- Apple Must
- Mac Rumors
- CounterPoint – Smartphone Share
- CounterPoint – iPhone Share
- StatCounter – Mobile
- StatCounter – OS
- Canalys
- StatCounter – Japan
- Apple Insider – Japan
- CounterPoint – China
- GizChina
- Statista – Canada
- IDC
- Business of Apps – Apps
- The Daily Star
- TechCrunch – Apps
- Statista – Shipments
- CounterPoint
- CounterPoint – India
- Tech Wire Asia
- BBC News
- CIRP – Ages
- Statista – Gender
- CIRP – Gender
- Statista – Population
- SlickDeals
- Statista – Age
- CIRP – Retention
- Beyond Identity
- Statista – App Stores
- Statista – App Spend
- Insider Intelligence – Traffic
- AirShip
- 9to5Mac – Batteries
- Apple Insider – Anniversary



User forum
1 messages