Texting Statistics: 28 Surprising Facts in 2026
Interested in texting statistics? Although trillions of texts are sent every year, these numbers show a complicated relationship between messaging apps and traditional text messaging.
Let’s take a closer look at texting, its current and historic usage, and what the future holds.
Key Texting Statistics Everyone Should Know
- Approximately 18.7 billion texts are sent every single day.
- Phone users in the Philippines send the most texts per capita.
- WhatsApp surpassed texting with 42 billion messages sent every day in 2016.
- SMS makes up less than 14.7% of wireless telecom carrier revenue.
- Mobile operators may lose $3 billion in SMS revenue globally over the next five years.
- The US SMS marketing market is expected to grow to $12.6 billion by 2025.
Global Texting Statistics
These texting statistics overview the big numbers, including how many texts are sent and which countries are sending them.
1. Approximately 18.7 billion texts are sent every single day.
(Sources: Textline, Vermont.gov)
According to the latest available figures, approximately 18.7 billion text messages are sent daily across the globe. That’s roughly 6.8 trillion a year. That number is expected to be much higher as it doesn’t include averages past 2017.
2. Over 150 billion texts were sent in the UK in 2012, dropping to 36.44 billion in 2022.
(Source: Statista – SMS UK)
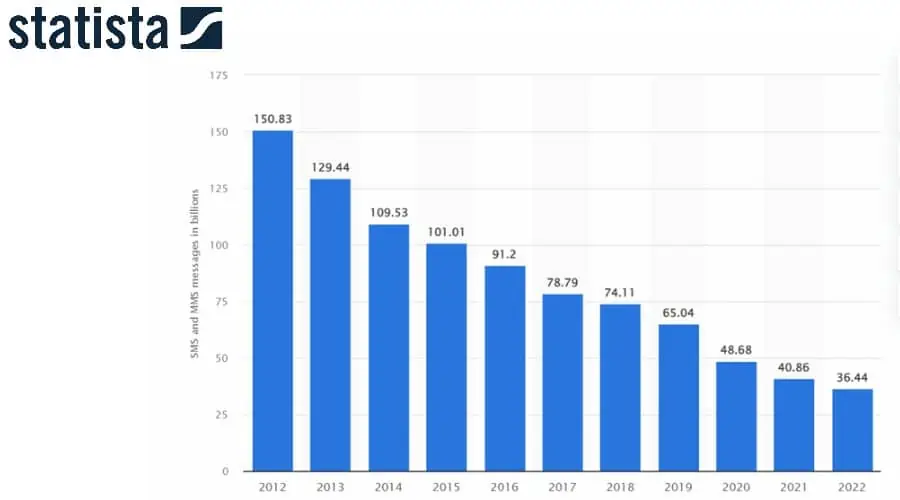
Despite social media apps taking hold by 2012, text messaging was still huge in the UK, with roughly 150.83 billion sent that year. A decade later this had dropped by over four times to just 36.44 billion.
3. US trends show a much steadier affinity for texting, with 2 trillion texts sent in 2021.
(Source: Statista – SMS US)
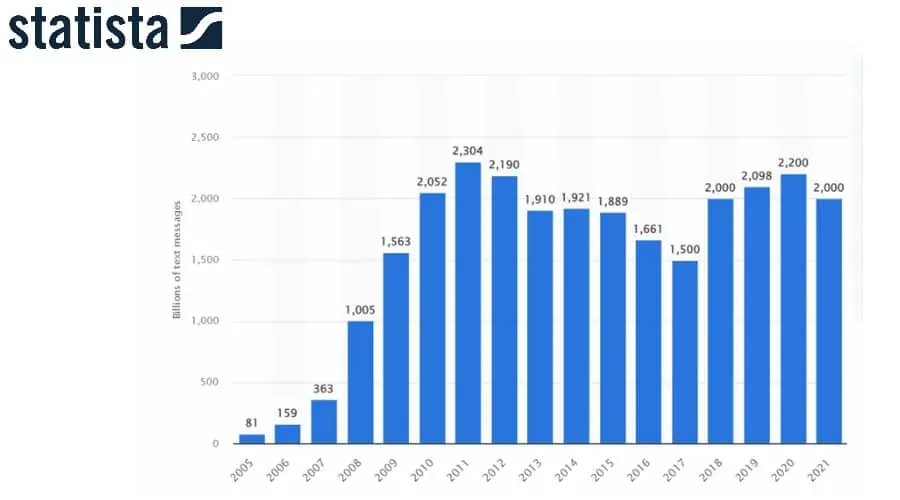
Unlike the UK, the US shows texting has staying power. Despite a decline from 2011’s peak of 2.3 trillion to its lowest point of 1.5 trillion in 2017, the number of texts shot up in 2018 to 2 trillion.
It grew to 2.2 trillion during the pandemic year of 2020. In 2021, 2 trillion text messages were still being sent in the US.
4. China sent 1.295 trillion texts in 2022.
(Sources: Statista – SMS China, Statista – Phone Usage China, Pew Research Mobile Fact Sheet)
With over four times the population of the United States, China isn’t such a big nation of texters. In 2022, 1.295 trillion messages were sent, an increase from the 1.217 trillion figure the year prior. Yet this still falls short of the United States’ 2 trillion estimate.
As of 2022, 72% of the Chinese population use a cell phone compared to 92% in the US.
5. Phone users in the Philippines send the most texts per capita.
(Source: Whispir, Philippine Mission)
A combination of lower internet adoption and smartphone usage makes the Philippines the highest texting country per capita. It has even been dubbed the texting capital of the world.
6. Texting’s decline began as early as 2010.
(Source: CTIA)
The first sign that texting was about to decline came in 2010 when its growth rate dropped from 55.5% in 2009 to 31.3% in 2010. By 2012 all growth had fizzled out.
Texting Statistics and Mobile Carriers
How do the texting statistics reflect on mobile operators and carriers?
7. AT&T is the largest texting provider in the world.
(Source: Statista – Telecom Worldwide)
AT&T is by far the global market leader, with revenues of 161.5 billion Euros or approximately $150 million in 2020.
This is followed by Verizon, China Mobile, and Comcast. German firm Deutsche Telekom is the largest in Europe with revenues of 80.5 billion but sixth overall. The UK firm Vodafone is 11th in the list with 43.7 billion.
8. SMS makes up less than 14.7% of wireless telecom carrier revenue.
(Source: IBISWorld)
When broken down by service, SMS texting is grouped into voice calls and multimedia messaging (MMS). Combined, this service only accounts for 14.7% of wireless telecom carrier revenue globally.
By far the biggest revenue generator is mobile data at 67.7%.
9. Mobile operators may lose $3 billion in SMS revenue globally over the next five years.
(Source: Juniper Research)
The texting business isn’t as lucrative as it once was thanks to more affordable mobile plans and less return on investment for businesses using texts for marketing. Based on data from 60 countries, operators are set to lose $3 billion on texts globally over the next five years.
10. UK mobile network revenue from SMS texting and MMS has decreased to £180 million.
(Source: Statista – UK Texting Revenue)
As of Q4 2022, UK mobile carrier revenue generated by texting fell to £118 million. Revenue has steadily been declining since 2012, which saw £589 million in revenue.
12. Texting scams cost victims $330 million a year.
(Source: FTC)
According to the Federal Trade Commission, texting scams cost victims $330 million a year. The most common scam involves fraudsters posing as bank representatives.
Others involve Amazon impersonation, fake job offers, delivery cons, and claims that the victim has won a free gift.
Texting Statistics vs Messaging App Stats
Just how close are the number of texts sent compared to the number of messages sent using Messenger, WhatsApp, and other apps?
13. WhatsApp surpassed texting with 42 billion messages sent every day in 2016.
(Sources: VentureBeat, Statista – WhatsApp)
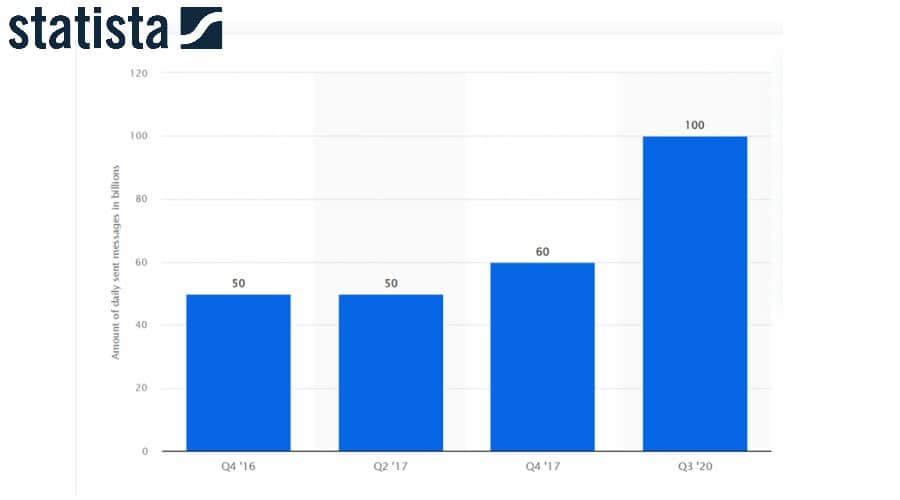
There’s been a huge rise in app messaging globally. WhatsApp roughly doubled the number of messages compared to texts sent each day to 42 billion in 2016. This more than doubled by Q3 2020, when it surpassed 100 billion daily messages.
14. Facebook Messenger surpassed texting with 70 million active users in 2017.
(Sources: TechCrunch, UseSignHouse)
Similarly, Facebook revealed Messenger had 70 million active daily users in September 2017. The number of individual messages will therefore have been much higher. Some estimates put it at 14 billion per day.
15. Telegram is a distant third in the messaging app market.
(Source: WorldPopulationReview)
The third most popular messaging app is Telegram, recording 700 million monthly active users in 2023 and 55.2 million daily active users.
16. Chinese WeChat has 450 million daily active users.
(Source: Enterprise Apps Today)
WeChat, which is the most popular messaging app in China, has 450 million daily active users sending 45 billion messages. It’s surpassing the likes of Telegram, and Facebook Messenger. This is also more than the 3.5 billion traditional texts sent every day in China.
17. The average cost of sending a text message in the UK is just 1.97 pence (plus VAT).
(Source: Gov.UK)
The cost of texting has gradually reduced over the years. The UK government now states that when someone has used their allotted allowance of free texts, it costs just 1.97 pence (plus VAT) for each message.
Historical Texting Statistics and Facts
From humble beginnings to trillions of texts flying through the ether, here are some of texting’s biggest milestones.
18. The first ever text message was ‘Merry Christmas’.
(Source: Vodafone)
The first ever cellular text message was sent by Neil Papworth on December 3rd, 1992, wishing a “Merry Christmas” to the recipient. However, this wasn’t to a loved one, but rather his employer at the UK’s Vodafone company where he worked as an engineer.
19. Texting came to the public in 1993.
(Source: Mobivity)
A year after Neil’s holiday message, Nokia introduced the first mass-available handset that supported texting. Until then, it was a receive-only process for voice mail and billing alerts.
20. Monthly texts per user were as low as 0.4 in 1995 and didn’t take off until the year 2000.
(Source: Heymarket)
Texting took several years to become a commonplace form of communication. In 1995 the average American cell phone user sent less than one message a month. Even in the year 2000 when handsets were readily available for adults and teens, this average only jumped to 35 a month.
As prices met demand, 2002 saw hundreds of billions of texts sent around the world.
21. Google search interest in ‘text messaging’ has steadily declined since 2004.
(Source: Google Trends)
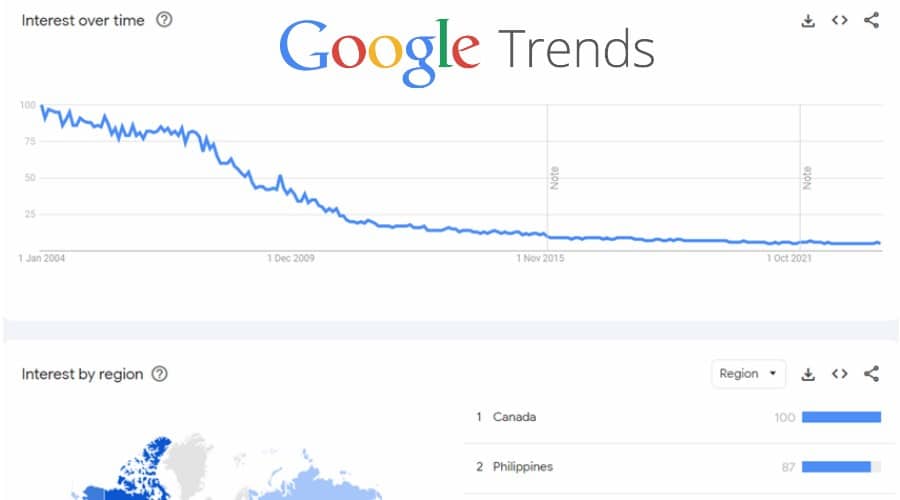
Since the start of Google Trends data, interest in ‘text messaging’ has steadily declined globally. There were peaks around the time of the original iPhone release in 2007 and the original Samsung Galaxy release in 2009.
22. Canada and the Philippines are the top two regions historically searching about ‘text messaging’.
(Source: Google Trends)
The most interest in the search term ‘text messaging’ comes from Canada and the Philippines. The latter is explained by the fact that the country has the highest per-capita texting in the world.
23. Libya introduced the first SMS-based voting registration system in 2015.
(Source: World Policy)
To get higher turnouts for Libyan elections, the Caktus Group developed the first voter registration process in the world that could be done via an SMS text message. This quickly saw 1.5 million citizens register to vote, which was a record for the country.
SMS Marketing Statistics
SMS marketing continues to bring results and grow. These texting statistics give an overview of its success and why it works.
24. Global A2P SMS revenue is expected to grow to $45.93 billion by 2025.
(Source: Statista – A2P SMS)
A2P or Application to Person is a form of automated or no-reply text messaging used by marketers, security verification, and other services.
This form of texting is still on the rise globally and is expected to reach revenues of $45.93 billion by 2025.
25. The US SMS marketing market is expected to grow to $12.6 billion by 2025.
(Source: Grand View Research)
In the US, SMS marketing was valued at nearly $5 billion in 2020 and is forecast to grow to $12.6 billion by 2025. That’s a compound annual growth rate (CAGR) of 20.3%.
The benefit of reaching consumers without internet and the low advertising cost are cited as two main drivers of growth.
26. SMS has a 98% open rate.
(Sources: Adobe, Campaign Monitor)
One clear reason why marketers favor texting is the staggeringly high open rate. A good email open rate is between 17 and 28%.
27. 60% of consumers open texts within 1-5 minutes.
(Source: SimpleTexting)
A 2020 survey revealed that 60% of all consumers opened text messages within 1-5 minutes of receiving. 42% of millennials check texts at least 10 times a day.
28. Texting is ranked higher than email as a brand communication channel.
(Source: Validity)
As of 2023, 19% of survey respondents stated texts as their favored brand communication method. They preferred it over email, social media, direct mail, or app notifications.
Texting Statistics: The final word
While it’s clear that traditional mobile phone use is here to stay, these texting statistics reveal a strong trend toward internet messaging apps.
Most interestingly, in some markets, this is in addition to a steady and continued use of texting, rather than a replacement. Texting in marketing also remains strong.
Sources:
- TextLine
- Vermont.GOV
- Statista – SMS UK
- Statista – SMS US
- Statista – SMS China
- Statista – Phone Usage China
- Pew Research Mobile Fact Sheet
- Whispir
- Philippine Mission
- CTIA
- Statista – Telecom Worldwide
- IBIS World
- Juniper Research
- Statista – UK Texting Revenue
- FTC
- VentureBeat
- Statista – WhatsApp
- TechCrunch
- UseSignHouse
- WorldPopulationReview
- Enterprise Apps Today
- Gov.UK
- Vodafone
- Mobivity
- Heymarket
- Google Trends
- World Policy
- Statista – A2P SMS
- Grand View Research
- Adobe
- Campaign Monitor
- SimpleTexting
- Validity
Read our disclosure page to find out how can you help MSPoweruser sustain the editorial team Read more


Improve this guide

User forum
0 messages