How to Check GPU Health - Complete Guide to GPU Health Test
Wondering how to test GPU health on your PC as a gamer or graphic editor? This article will explore different methods you can use to monitor GPU performance on Windows computers.
GPUs often experience wear and deteriorate in their functioning over time. As a result, it creates a bottleneck in your PC. This can lead to malfunctioning and a decline in your overall performance.
Hence, it’s vital to regularly check GPU health, especially when you face problems like lower frame rates or lag. So, let’s jump right in!
Why GPU Health Matters?
GPU health matters because your PC’s handling of gaming, video and photo editing, content creation, and design, depends on it. Basically, this card is in charge of visual tasks such as graphics and videos. So, if it’s in decline, you may notice:
- Strange graphical glitches and artifacts
- Frequent crashes during games or other intense tasks
- Abnormal fan noise or dying fans
- Lag and frame drops
- Blue screens and critical errors.
This can impact your productivity and general enjoyment when using your PC. Ultimately, if ignored, your graphics card may die.
How To Test GPU Health?
In this section, I’ll show you how to check GPU health. In my experience, the most important metrics you should look out for are GPU memory usage and temperature. You should also check for errors using the methods listed below:
1. Use Windows Task Manager
This is the most basic way to test GPU health on your computer. Windows Task Manager offers valuable information for evaluating the GPU’s condition. To use this, simply follow the steps provided below:
1. Press Ctrl + Shift + Esc keys on your computer to open the Task Manager.
2. On the navigation pane, select the Performance option.
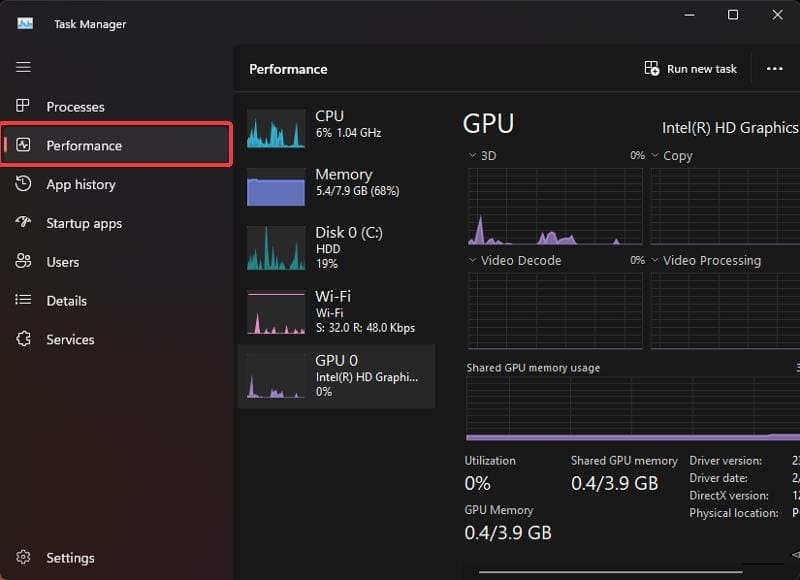
3. In the Performance section, you’ll find a list of your computer’s primary hardware components, including the video card for a GPU health check.
The information you see on this GPU performance page normally depends on the graphics processes running on your computer. This information includes memory usage and temperature. However, if you observe elevated readings of those metrics when running only simple programs, it could suggest a problem.
This could be due to the GPU’s deteriorating performance over time or a malfunctioning fan.
2. Use Device Manager
The Device Manager lists various device drivers on your computer. However, it also helps reveal the status of your computer’s hardware components, including the GPU.
To check GPU health via the Device Manager:
1. Press Windows + X to open the Start menu, then select Device Manager.
2. After it launches, double-click the Display adapters option to show the GPU(s) available on your computer.
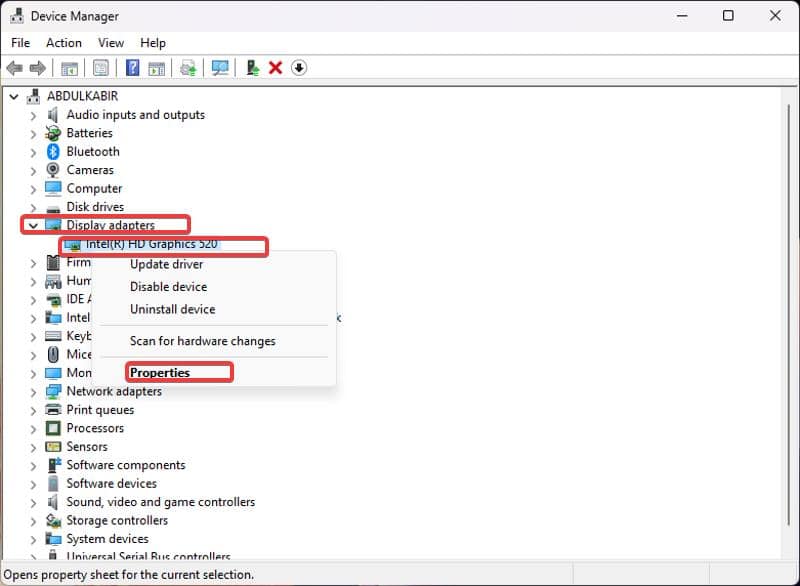
3. Now, right-click the GPU you want to test and select Properties.
4. On the resulting dialog box, check the Device status box.
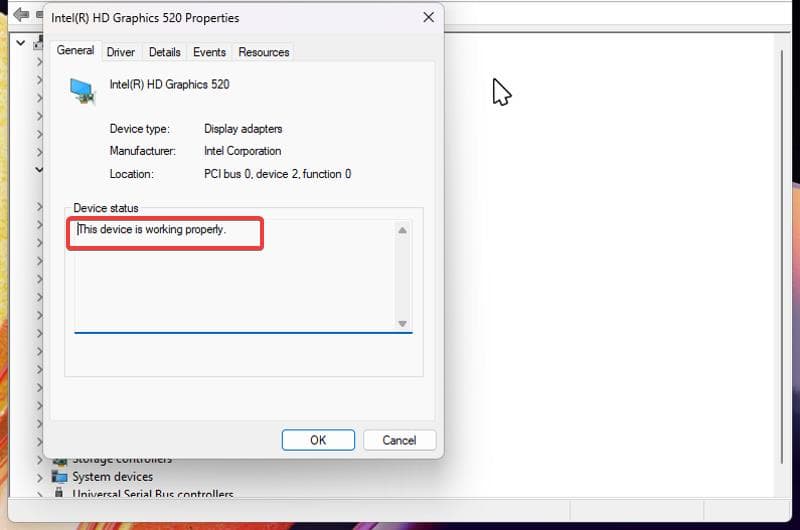
The Device status box will inform you of any problems or errors with your GPU. These include issues caused by running on a corrupt driver.
3. Check GPU Health via Windows Settings
If you’re wondering how to test GPU health, you can do so via Windows Settings. It takes you to the same display properties page as the Device Manager method we discussed earlier. Here’s how:
1. Press Windows + I to open the Windows Settings app.
2. Select System from the left pane, then click Display in the right pane.
3. Now, navigate to the Advanced display option and click on it.
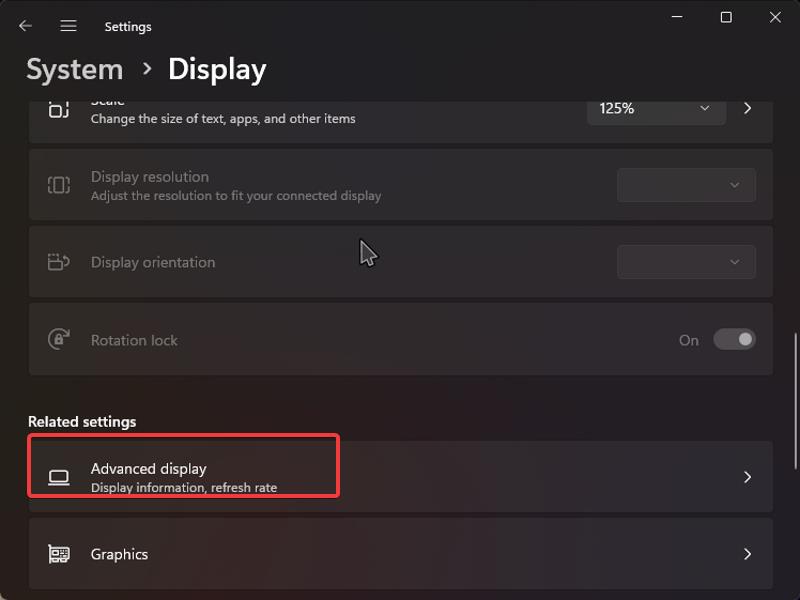
4. Click the Display adapter properties for Display 1, then select Properties next to the GPU you want to test.
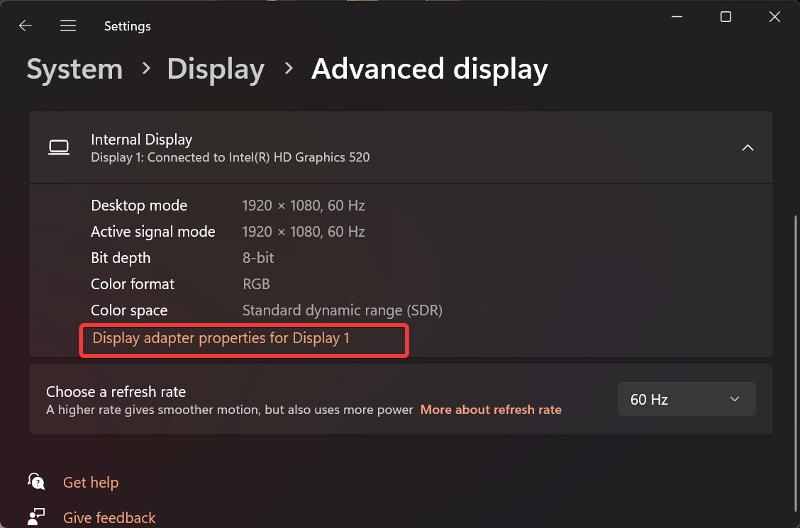
5. You’ll be directed to the GPU properties window with the Device status box that lists errors.
4. Use the DirectX Diagnostic Tool
The DirectX Diagnostic tool is primarily designed to monitor DirectX functionality on Windows computers. However, it’s another effective method for a GPU health test. Simply follow these steps:
1. Press Windows + R, type dxdiag in the box, and press Enter.
2. Switch to the Display tab on the window.
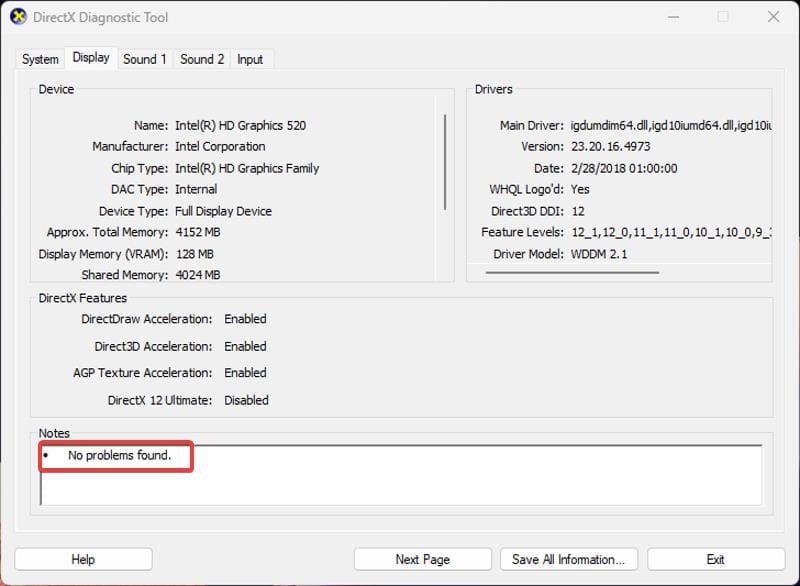
3. You’ll see a section headed with Notes at the bottom of the page. It’ll list any potential GPU issues.
However, it’s important to note that the problems identified in this section are primarily related to software. Hence, if your GPU experiences overheating, you won’t be alerted until it reaches a critical state.
This underscores the importance of using multiple testing methods.
5. Use GPU Benchmarking Tools
You can use GPU benchmarking tools to test GPU health. Furmark and MSI Afterburner are arguably the most effective methods. They’re designed to stress your GPU with simulated graphics tasks and evaluate its performance.
Moreover, they gather data on GPU performance through various metrics, including frame rate, rendering time, and GPU temperature during the stress test.
If you get readings that deviate significantly from the comparison ranges for each metric, it may indicate there may be an issue.
Related Reads:
Conclusion
In conclusion, this guide provides several methods for you to understand how to check graphics card health. You should regularly test GPU health to see whether your card is functioning properly or if it’s on the verge of failure.
If you encounter irregular readings or errors during testing, it may indicate hardware or software problems. Hence, you may need a driver update or a GPU replacement, depending on the case. I recommend using at least three methods, including GPU benchmarking, for a thorough evaluation.
Read our disclosure page to find out how can you help MSPoweruser sustain the editorial team Read more



User forum
0 messages