Microsoft Power BI service now supports reports and dashboards with R visuals
![]() 1 min. read
1 min. read
![]() Published on
Published on
Share this article

Improve this guide
Read our disclosure page to find out how can you help MSPoweruser sustain the editorial team Read more
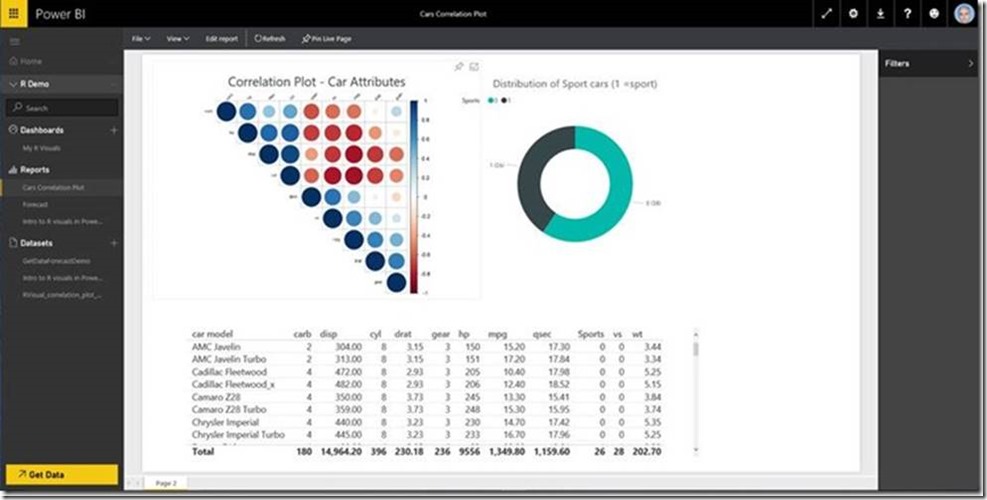
Microsoft yesterday announced that the Power BI service has added support for reports and dashboards with R visuals. This expands Power BI service visuals with endless flexibility, and adds advanced analytics depth. Also, the R visuals are fully integrated into Power BI service reports, and can be filtered, cross filtered, and pinned to dashboards. Also they behave in the service like any other visual in Power BI which means users can interact, filter, slice, and pin them to a dashboard, or share them with others. R visuals in Power BI service are enabled only for domain verified Pro users and it supports hundreds of the mostly used R packages.
For more information on R visuals in the service, see Use R scripts in Power BI to create advanced analytics and visualizations.