Microsoft Garage releases a new data visualization tool for PC and Surface Hub
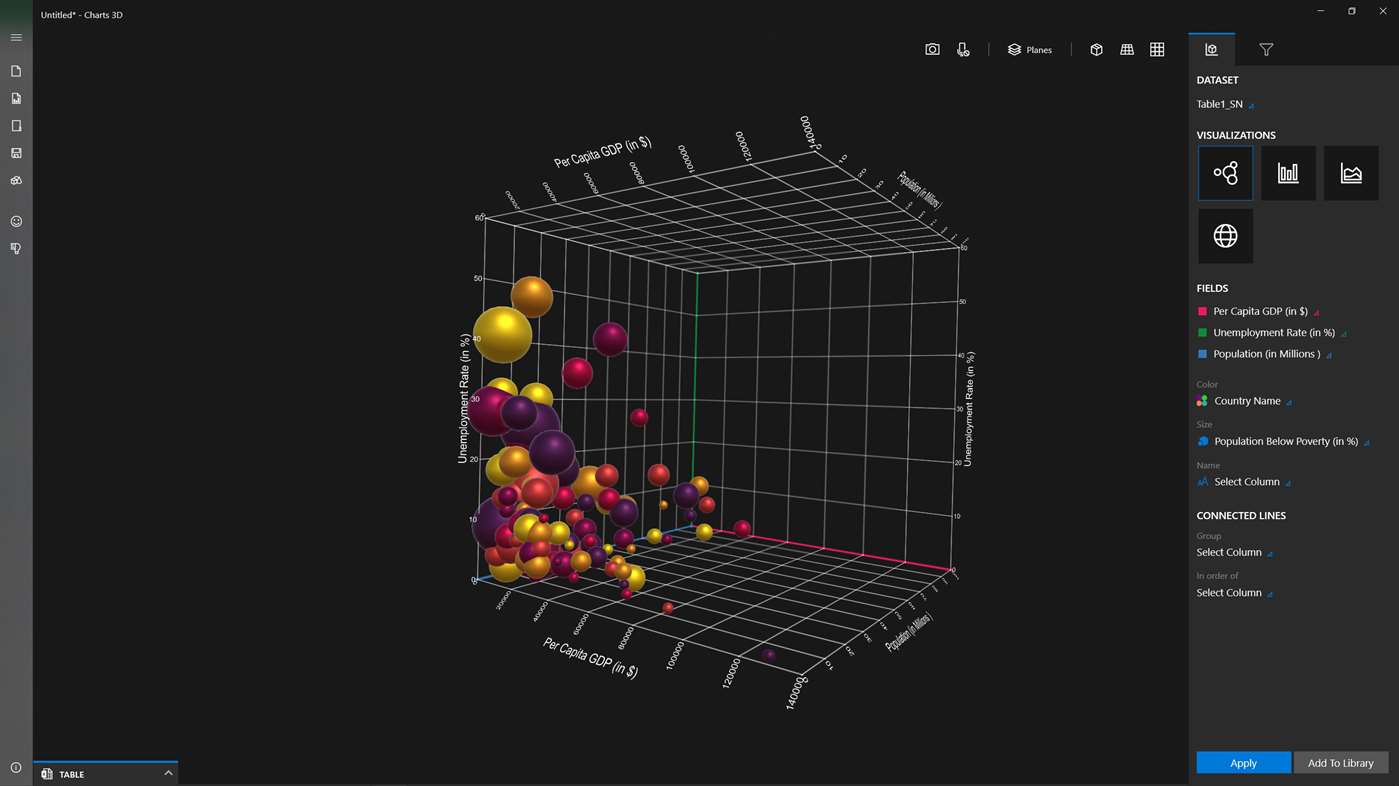
Microsoft Garage today released a new data visualization tool called Charts 3D for PC and Surface Hub. It allows users to to better visualize and explain complex graphs and charts using a more immersive, interactive 3D object.
“Excel and PowerPoint have lots of amazing features that help you build rich and beautiful charts. However, we kept hearing feedback that when data gets really complex, users often struggle to decide which chart will be best to visualize the data and land the insight,” said Alok Agrawal, Program Manager for Charts 3D.
To create a visualization, users have to just drop in two sets of data, and Charts 3D will generate a three-dimmensional, interactive graph or chart. Users can zoom, rotate, or pan different graphs and charts using mouse or touch to quickly find the most interesting aspect of their results.
App Features:
Download the app here from Microsoft Store.
Learn more about this project here.
Read our disclosure page to find out how can you help MSPoweruser sustain the editorial team Read more



User forum
0 messages