Microsoft announces support for charts in Access to enable data visualization
![]() 1 min. read
1 min. read
![]() Published on
Published on
Share this article

Improve this guide
Readers help support MSpoweruser. We may get a commission if you buy through our links.

Read our disclosure page to find out how can you help MSPoweruser sustain the editorial team Read more
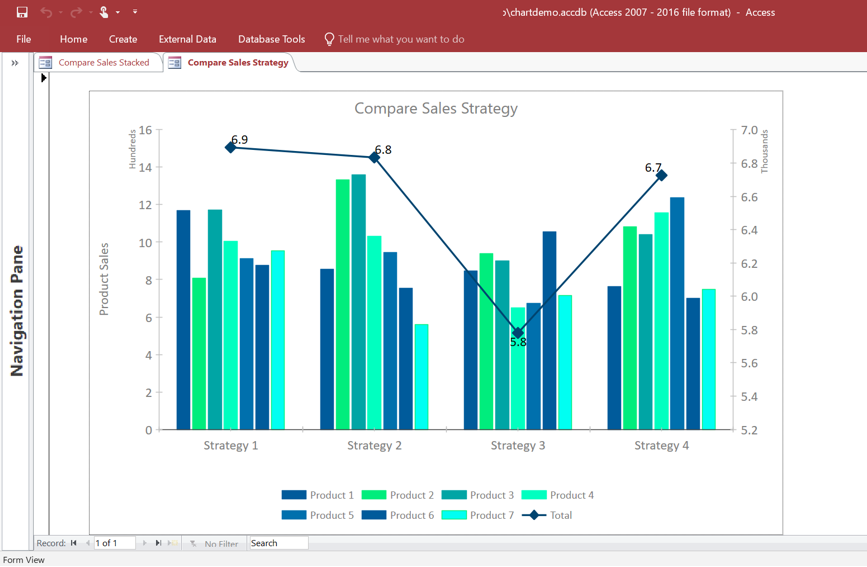
Based on the feedback from customers to modernize data visualization in Access forms and reports, Microsoft yesterday announced support for charts in Access. With this new charts feature, you can easily create and edit charts and visualize data in a easy way. Read about the new charts feature below.
- Easily create modern looking charts, of various types:
- Choose any of the 11 supported chart types to represent your data.
- Use the new Chart Settings Pane to set the chart’s data source and dimensions (Category Axis, Legend, Values Axis)
- Use the new Chart Settings Pane to format the chart’s data series.
- Easily edit the chart and data series properties:
- Use the familiar Property Sheet to edit chart properties.
- Use the new Chart Settings Pane to edit the chart’s data series.
- Preview live data as you design charts on your form/report
Office 365 Insiders in the Fast Ring with Access version 1805 (Build 9312.1000) or later can now try out this new feature.
Source: Microsoft