24 Important iPad Statistics to Know in 2026
After launching in 2010, the Apple iPad quickly became the most popular tablet device in the world, a title it still claims today.
Currently in its 10th generation, it continues to be at the forefront of display quality and resolution, and overall performance.
We crunched all the data to find the most interesting iPad statistics, looking at its historical rise, market share, and other fun facts most people don’t know.
Top iPad Statistics Everyone Should Know
These statistics provide an overview of everything you need to know about the iPad in 2023.
- 8 million iPads were shipped worldwide in 2022.
- Apple iPad is the most popular tablet in the world with a 53.55% market share.
- 73% of Apple customers own an iPad.
- More younger people own iPads in the UK, while more older people own iPads in the US.
- More than half of businesses that use iPad are in the United States.
Shipments and Revenue iPad Statistics
Just how many iPads does Apple ship and how much money does it make from its tablet range?
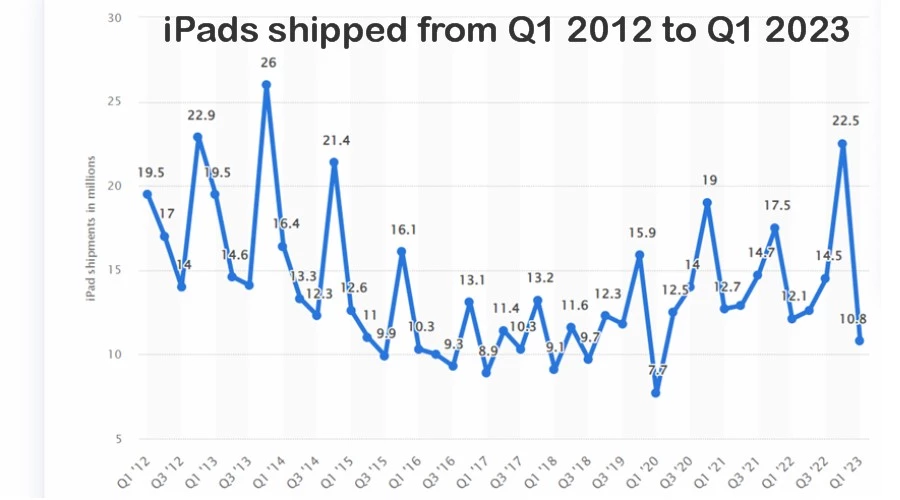
1. 61.8 million iPads were shipped worldwide in 2022.
(Source: Statista – iPad Shipments)
Last year Apple shipped a total of 61.8 million iPads worldwide, a 7% increase from the prior year. Around 22.5 million units were shipped in the fourth quarter alone. This dropped by nearly half in the first quarter of 2023.
Its highest quarter in history was the fourth quarter of 2013, when a staggering 26 million devices were shipped.
2. Half of the tablets shipped in the US in Q1 2023 were iPads.
(Source: MacDailyNews)
Apple iPad dominated shipments in the first quarter of 2023, accounting for 50% of all tablets shipped in the country. Despite this, the 10.8 million units moved by Apple was a 7% drop from this quarter last year.
As well as outperforming all other tablets, iPad shipments also outperformed desktops, notebooks, and workstations.
3. Since 2010, Apple has shipped more than 550 million iPads worldwide.
(Source: Statista – iPad Shipments 2, LifeWire)
Since the iPad first went on sale in 2010, Apple has shipped approximately 550 million units across all models, worldwide, excluding 2023. No other single tablet brand has been this successful to date.
4. Apple made $26 billion in revenue from iPad sales in 2022.
(Source: Statista – iPad Revenue)
In the first quarter of 2023, iPad sales made $9.4 billion in revenue for Apple, which was up from $7.25 billion in the same quarter in 2022. In total, the corporation made $26 billion in the whole of 2022.
This is its third highest-grossing year, behind 2021, when iPad made $31 billion, and 2013 when revenues reached $32 billion during the boom of the iPad 4 and first-ever iPad Mini.
5. iPad accounts for 7.4% of Apple’s revenue.
(Source: Investopedia)
By accounting for just 7.4% of total Apple revenue in 2022, iPad made the least revenue of any other Apple product range. In comparison, iPhone accounted for 52.1% of revenue, Wearables including Apple Watch and AirPods accounted for 10.5%, and Mac was 10.2%.
Market Share iPad Statistics
The battle between Apple and Samsung extends to the tablet market. Here’s how iPad ranks across the world, including regions where Samsung has the advantage.
6. Apple iPad is the most popular tablet in the world with a 53.55% market share.
(Source: Statcounter)
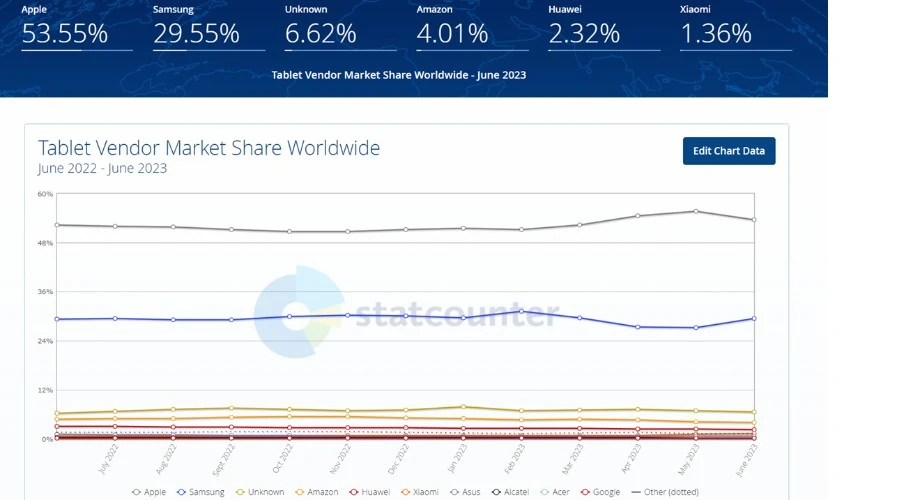
As of June 2023, the iPad has a 53.55% share of the global tablet market, making it the most popular in the world. This is followed by Samsung (29.55%), unknown brands (6.62%), Amazon (4.01%), Huawei (2.32%), and Xiaomi (1.36%).
For 2022, iPad averaged a 52.62% market share and has been steadily declining since 2019 (70.32%). It’s best position in the past 10 years was 2013, when it dominated the market with a 75.24% share.
7. Samsung Galaxy tablets are the closest competitor to the iPad with a 28.88% market share.
(Source: Statcounter)
Just like the smartphone market, Samsung is Apple’s closest competitor in the tablet market. As of June 2023, Samsung Galaxy tablets have a 29.55% market share, up from the 2022 average of 28.88%.
Unlike Apple, Samsung has seen consistent growth over the past 10 years, more than double its 2013 market share of 10.59%.
8. iPads are favored in North America, Europe, Oceania, and Asia.
(Source: Statcounter)
The iPad has a particularly strong hold over Oceania (78.1% market share), Asia (57.44%), North America (55.8%), and to a lesser degree Europe (49.32%), where Samsung has a 33.62% share. Germany, France, and Italy are outliers that prefer Samsung tablets in the region.
However, Samsung dominates in Africa with a 74.55% market share. South America also favors Samsung, with a 44.53% market share compared to iPad’s 28.47%.
9. In North Korea and Japan, the iPad dominates the market.
(Source: Statcounter)
When looking at individual countries, North Korea is almost 100% iPad, due to bans and sales embargos. Apple dominates because there is a thriving black market for what is perceived as a more secure device that cannot be tracked by the government.
Japan favors Apple so much that iPad has a 75.64% market share, while Samsung has just 2.49%.
Other countries where iPad dominates include Denmark (76.07%), Canada (67.45%), and Norway (66.65%).
10. iPad was more popular than the iPhone at launch.
(Source: Apple)
On the day it launched in 2010, over 300,000 iPads were sold. These users generated over one million app downloads and over 250,000 eBook downloads from Apple’s then iBookstore.
It took the iPhone several weeks to pick up this amount of steam in 2007, though it was also entering a brand-new market. iPad had a boost from iPhone and Apple’s wider success at the time.
Demographics and other interesting iPad Statistics
These statistics explore who makes up the iPad’s user base and their behavior.
11. More younger people own iPads in the UK, while more older people own iPads in the US.
(Source: Statista – iPad Ages)
In the United Kingdom, there are more iPad owners in the 18-19 (61%) age bracket and 20-29 age bracket (60%) than any other group. On the other hand, in the United States the share of iPad owners in the 30-49 age bracket is the biggest (55%).
12. 73% of Apple customers own an iPad.
(Source: 9to5Mac – Apple Ownership)
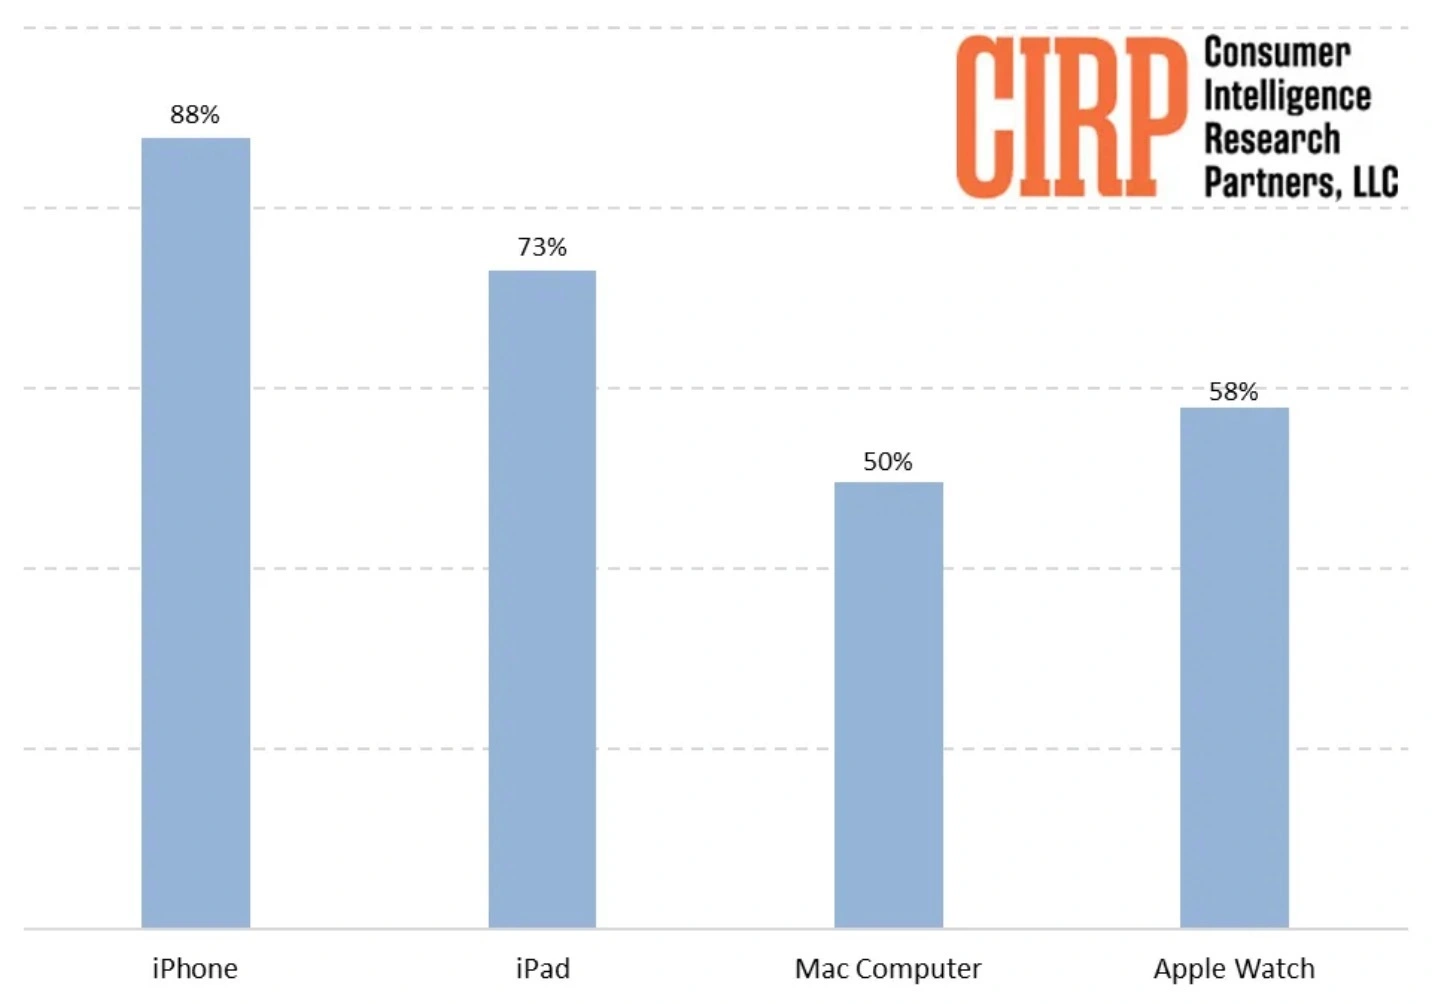
The iPad is Apple’s second most popular device behind the iPhone. Of people that own at least one Apple device, 73% own an iPad, while 88% own an iPhone. Mac computers and laptops are the least popular Apple products.
13. Only half of all iPad devices currently run on the latest iPadOS 16.
(Source: Mac Rumors)
According to data released by Apple at the start of 2023, operating system updates are much less common on the iPad than the iPhone. Only 50% of active iPads are using the latest iPadOS 16 compared to 72% of iPhones using iOS 16.
This is likely because iPad users tend to keep older devices longer and a slower update schedule from Apple itself.
14. The most popular iPad model is the iPad Pro.
(Source: 9to5Mac – iPad Models)
Based on survey data, the iPad Pro range is the most popular model of iPad, which includes the 11-inch and 12.9-inch versions (44%). The standard 10.2-inch iPad came in second (26%), followed by the iPad Air (19%), and iPad Mini (7%).
Users prefer the cellular-enabled models over iPads that only support Wi-Fi.
15. Samsung manufactures some Apple iPad displays.
(Source: Evening Standard)
Perhaps one of the biggest ‘did you knows’ is the fact that Samsung is actually the manufacturer of some of Apple’s display technology that can be found in the iPad and other products.
Apple also uses China’s BO and LG from Korea because it is more cost-effective. However, it was recently announced that the company plans to upgrade its screen technology and take it in-house.
Business iPad Statistics
It is not just individuals that use iPads, many businesses disperse them among office workers or use them for specific tasks like point-of-sale payment transactions.
16. Historically, as high as half of iPad sales are to companies and governments.
(Source: New York Times)
Apple has tailored many of its apps and accessories to businesses, which at times has resulted in almost half of yearly sales going to companies and government agencies rather than individuals.
17. The iPad is more popular in Information Technology companies.
(Source: Enlyft)
Data drawn from 93,000+ companies of all sizes reveal the iPad is most common in the Information Technology and Services industry (13%), followed by the Computer Software industry (8%).
The least common sector to use iPads is Financial Services.
18. The iPad is most popular among medium-sized businesses.
(Source: Enlyft)
Of all the businesses that use iPads, those with a medium number of employees use them most (44%), while 38% are small businesses, and only 19% are large businesses.
The opposite is true when it comes to revenue. The majority of iPad users are small businesses earning less than $50 million a year (69%). Large businesses earning more than $1 billion make up 16%, while medium-revenue businesses account for 8% of iPad users.
19. More than half of businesses that use iPad are in the United States.
(Source: Enlyft)
Approximately 56% of businesses that use Apple iPad are based in the United States, while the UK comes in second with 8%. The iPad is least popular among businesses in Spain.
iPad Apps Statistics
Although iPad has most of the same apps available on iOS, it has its own exclusives too. These statistics look at the most popular apps on iPad only and other interesting iPad app data.
20. Roblox is the highest-grossing app in the US on iPad in 2023.
(Source: Sensor Tower)
Although the game itself is free, Roblox has risen to the top in the US app revenue charts thanks to in-app purchases. So far in 2023, it is the highest-grossing app in the Apple App Store, followed by Candy Crush Saga and Royal Match.
Roblox also tops Canada, the United Kingdom, and Australia.
21. HBO Max is the most popular free iPad app in July 2023.
(Source: App Store)
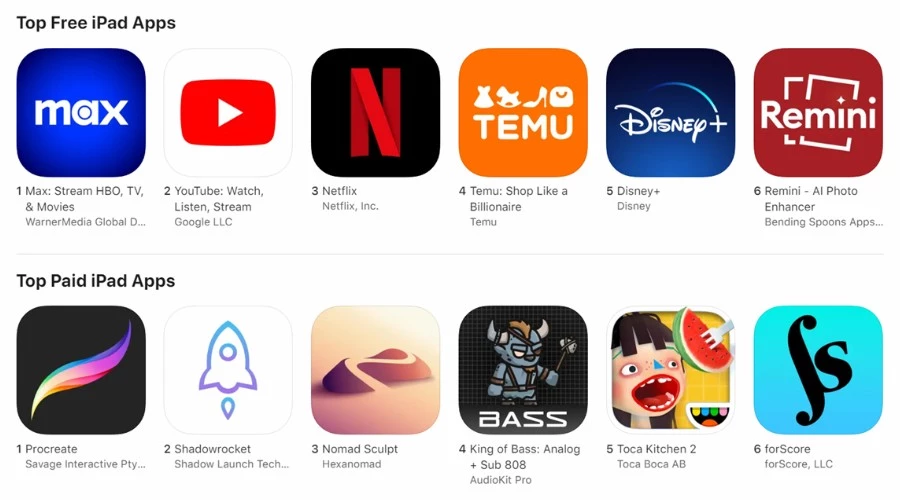
As of July 13, 2023, streaming service HBO Max is ranked the most popular free iPad app on the official Apple App Store. It’s followed by YouTube, Netflix, shopping app Temu, Disney+, and AI photo enhancer Remini.
In 5th is video editor CapCut, and 6th in the rankings is long-running favorite TikTok.
22. Procreate is the most popular paid iPad app in July 2023.
(Source: App Store)
As of July 13, 2023, sketch and painting suite Procreate is ranked the most popular paid iPad app on the official Apple App Store. It’s followed by internet proxy tool Shadowrocket, 3D sculpting and painting app Nomad Sculpt, music-making tool King of Bass, cooking app Toca Kitchen 2, and digital sheet music app forScore.
23. MONOPOLY GO! Is the most popular free iPad game in July 2023.
(Source: App Store)
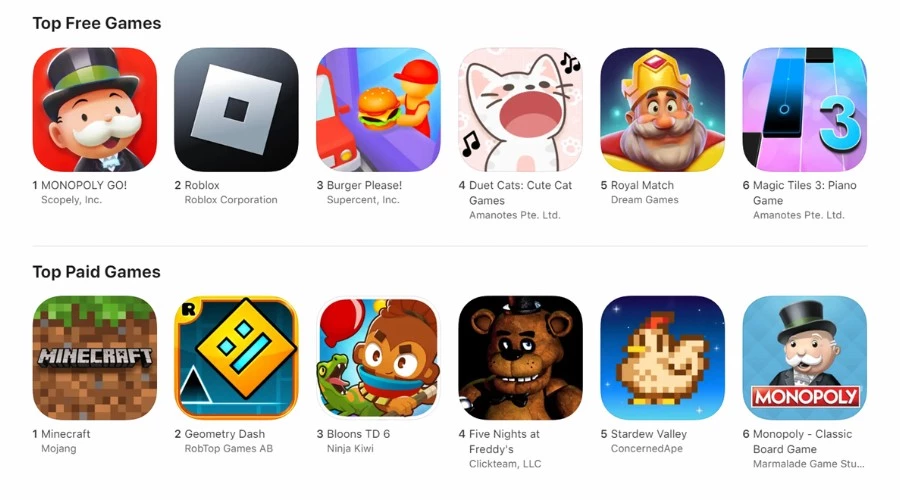
As of July 13, 2023, MONOPOLY GO! is ranked the most popular free iPad game on the official Apple App Store. It’s followed by Roblox, Burger Please, Duet Cats, Royal Match, and Magic Tiles 3: Piano.
24. Minecraft is the most popular paid iPad game in July 2023.
(Source: App Store)
As of July 13, 2023, Minecraft is ranked the most popular paid iPad game. It’s followed by Geometry Dash, Bloons TD 6, Five Nights at Freddy’s, Stardew Valley, and Monopoly Classic.
Conclusion
Despite decreasing market share in the face of rising Samsung, Apple’s iPad still remains the most successful tablet device in the world in terms of revenue and popularity.
It moves tens of millions of units across all models and generates billions in revenue every year.
Not bad for a device originally intended only to read eBooks.
Sources
Read our disclosure page to find out how can you help MSPoweruser sustain the editorial team Read more


Improve this guide


User forum
0 messages