ClickCharts Review - Is It Good Enough?
Read this comprehensive ClickCharts review to discover if the tool is suitable for your diagram-making needs.
Creating flowchart diagrams for UML, ER, data flow, BPMN, electrical circuits, and more is a complex task if you don’t have the right tool. Here comes the ClickCharts app, developed by NCH Software.
It’s a creative and technical wireframe drawing tool that uses visual elements like geometric shapes, connectors, text, arrows, images, etc.
It’s available for free download on Windows (all OSes from Win 7 to Win 11), Mac (macOS 10.5 or later), and Android tablets (5.0 and later) devices.
I used the tool extensively for a week to compile this ultimate ClickCharts review. Here, you’ll learn about its best features, user interface, support options, and pricing.
| Pros | Cons |
| Totally free diagramming app for non-commercial use. | The free version doesn’t allow commercial usage. |
| Multiple diagram-stylizing options like arrows, lines, connectors, text boxes, images, and more. | Its flowchart template library requires an internet connection. |
| You can modify the connectors to show straight, orthogonal, curved, rounded, etc., designs. | You must download a template each time you want to use it because the tool doesn’t cache the downloaded content. |
| The software works offline if you can create smart diagrams from scratch. | Moderate-level learning curve. |
| User-friendly interface. | You can’t edit diagrams and flowcharts if created in another app or the file isn’t in the CCD format. |
| You can save your flowchart in 19 different formats like PDF, PNG, PSD, JPEG, PCX, PBM, etc. | The mobile app is only compatible with tablet devices running Android OS 5.0 or later. |
| The tool requires minimal system resources | The mobile version isn’t yet available for Android smartphones and iOS devices. |
| The Android tablet version offers most of the features you can use on Windows or Mac computers. | It lacks sticky note elements. |
| Switching on and off the snapping feature is easier than most of its competitors. | You can’t use the tool for collaborative creation and editing of process flowcharts. |
| You can share a diagram or flowchart online using an in-app emailing interface. |
ClickCharts Features
Now let’s dive into the tool’s features and see how they perform:
Flowchart and Diagram Editor Canvas
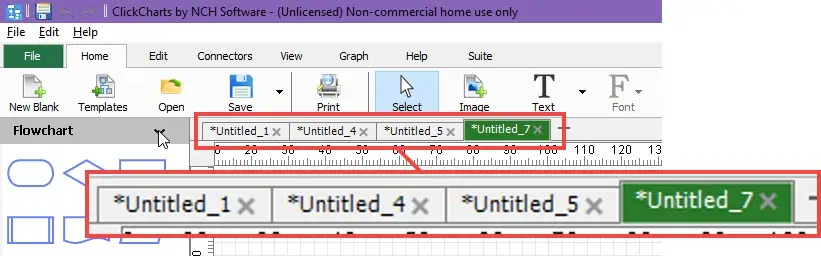
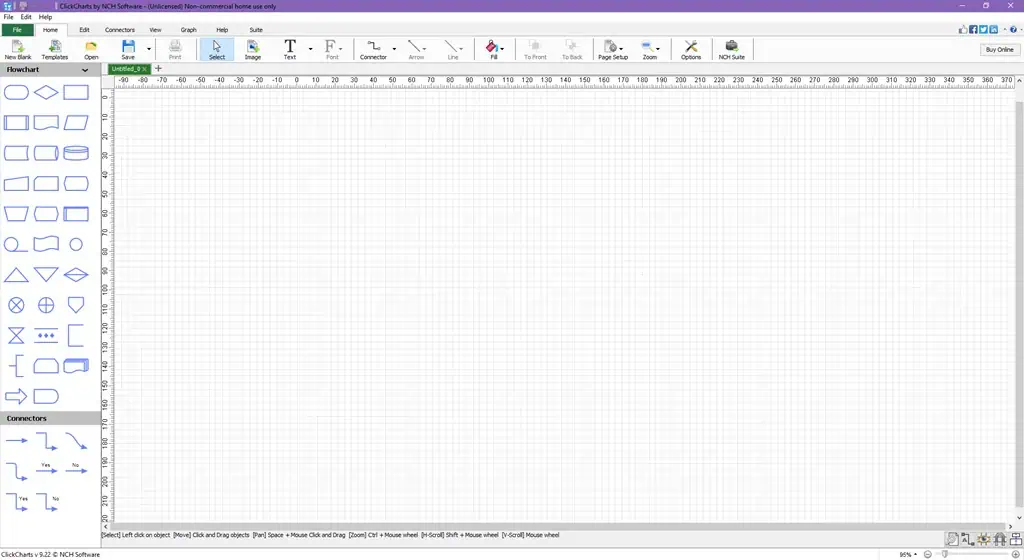
ClickCharts comes with a tab-based diagram designing and editing canvas.
You can open more than one design project as tabs. This way, you can multitask on many flowcharts at once, without swapping between multiple interfaces of the diagramming tool. It also reduces the memory usage.
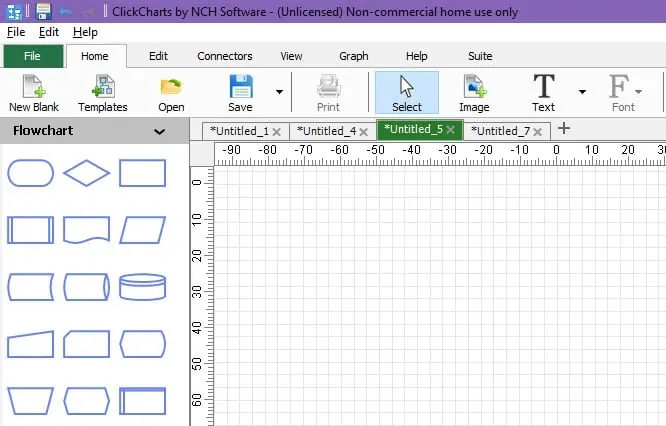
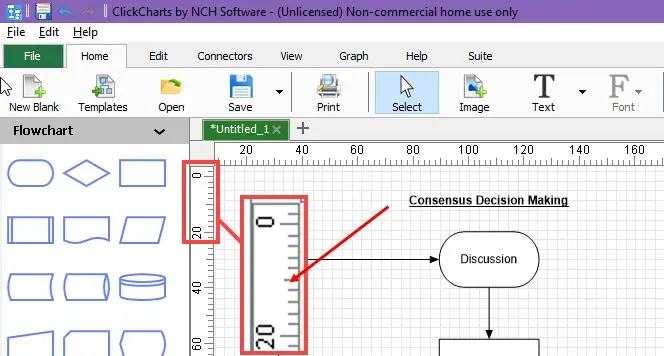
The editing canvas contains gridlines as you see in the Microsoft Office Excel app. These gridlines allow you to accurately place symbols and connectors aligning to the space available for printing. There’s also a millimeter scale ruler to help you understand if you’re going beyond the print limit or staying within the limit.
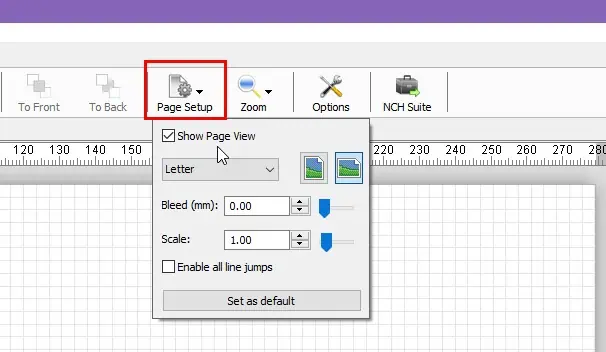
You can also switch to a Page View mode if you wish to see a preview of the printable area of the diagram.
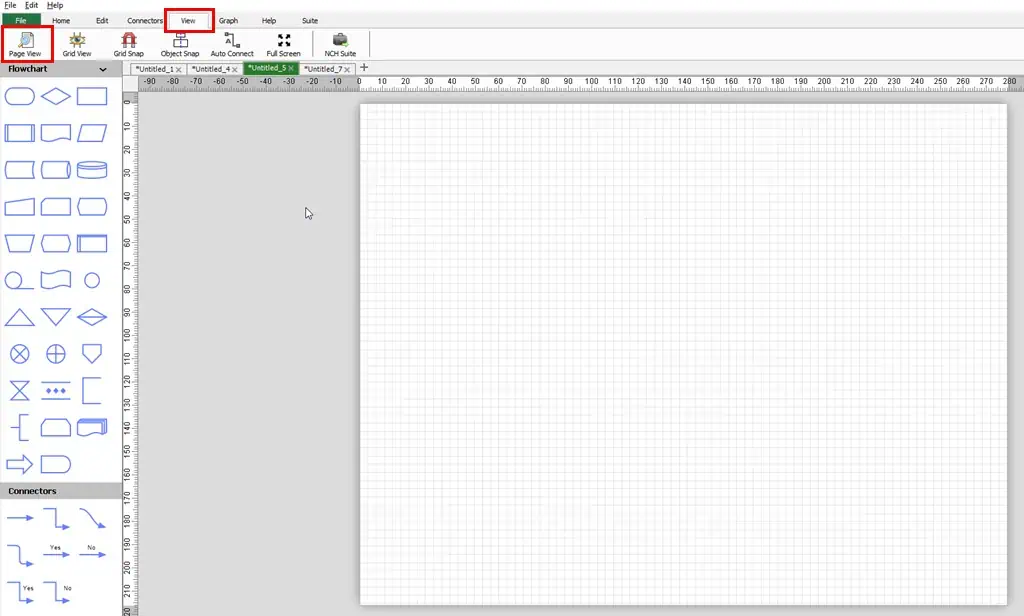
The view automatically adjusts to the page type you’ve selected in the Page Setup option on the Home tab.
The diagramming canvas doesn’t allow collaborative editing by sharing a link with remote users, unlike Lucidchart.
Extensive Collection of Symbols and Connectors
ClickCharts offers 26 different groups of symbols and connectors for diagramming and flowchart-making. The best thing is the tool organizes the relevant elements in a group. So, you don’t have to remember which symbol and connector types go to which diagram.
You only need to choose a design option and the app will populate all the allowed components for the wireframe.
To choose the right set of symbols and connectors, you simply visit the Home tab and click on the New Blank button to open a clean canvas.
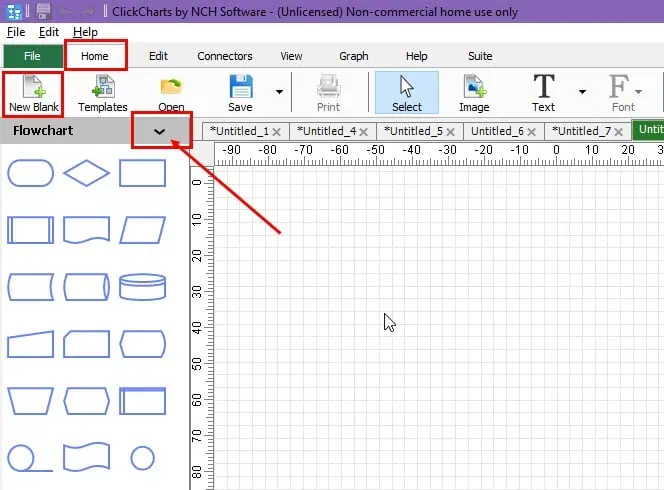
By default, the app will choose Flowchart as the selected group of diagram elements. You need to click the Flowchart drop-down menu to find an exhaustive list of symbols and connectors. For example, you can choose from the following major groups:
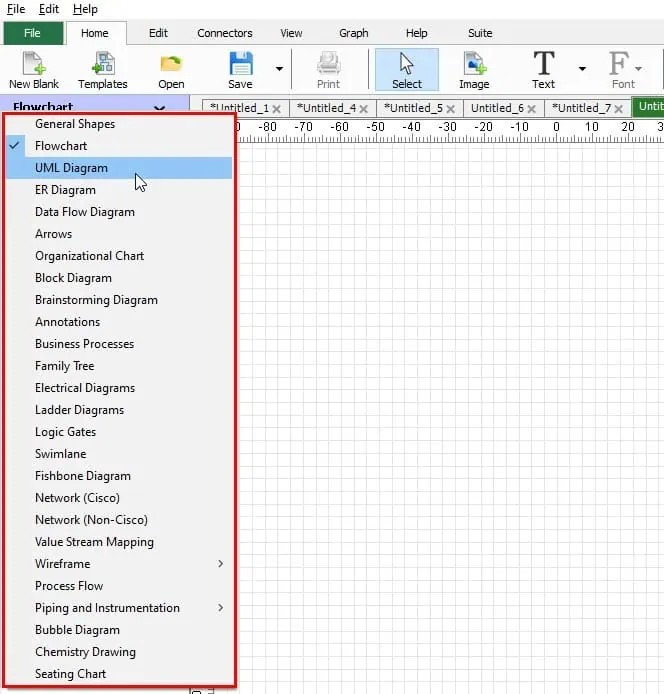
- UML Diagram
- ER Diagram
- Data Flow Diagram
- Arrows
- Organizational Charts
- Ladder Diagrams
- Wireframe
- Electrical/Wiring Diagram
- Process Flow
- Piping and Instrumentation
ClickCharts offers a limited set of symbols and connectors collection as compared to a competitor like Lucidchart. In the latter, you can find more than 30 groups of diagram components, some of which are important ones like AWS Architecture 2021, Google Cloud Platform 2021, Android Mockups, Kubernetes, etc.
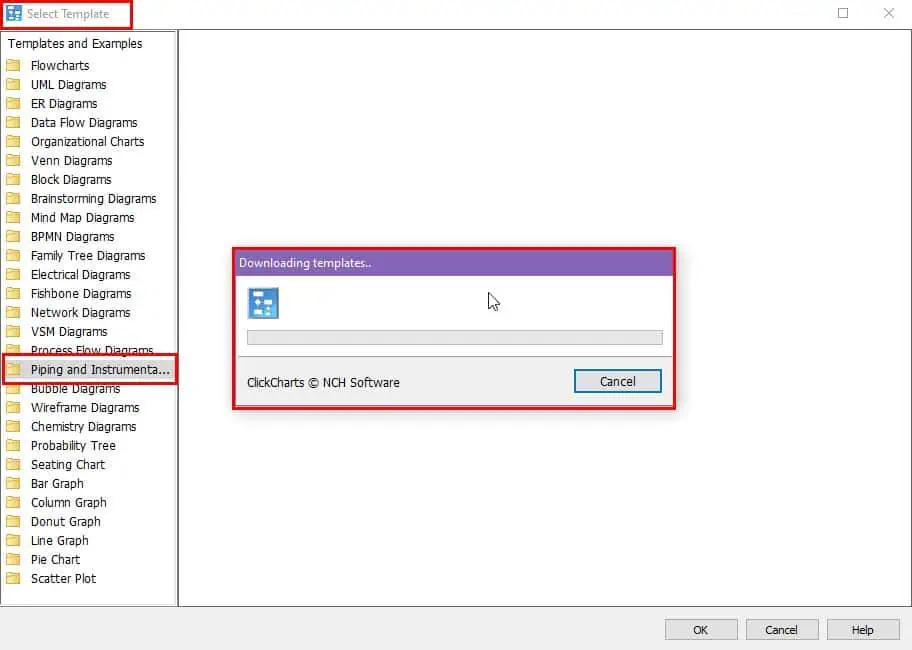
Flowchart Templates Library
To make your life easier, the tool offers an extensive library of popular flowcharts you can use. These examples are from various fields, like education, engineering, business process, productivity, time management, and many more.
You can find the Templates option in the Home tab on the top menu bar.
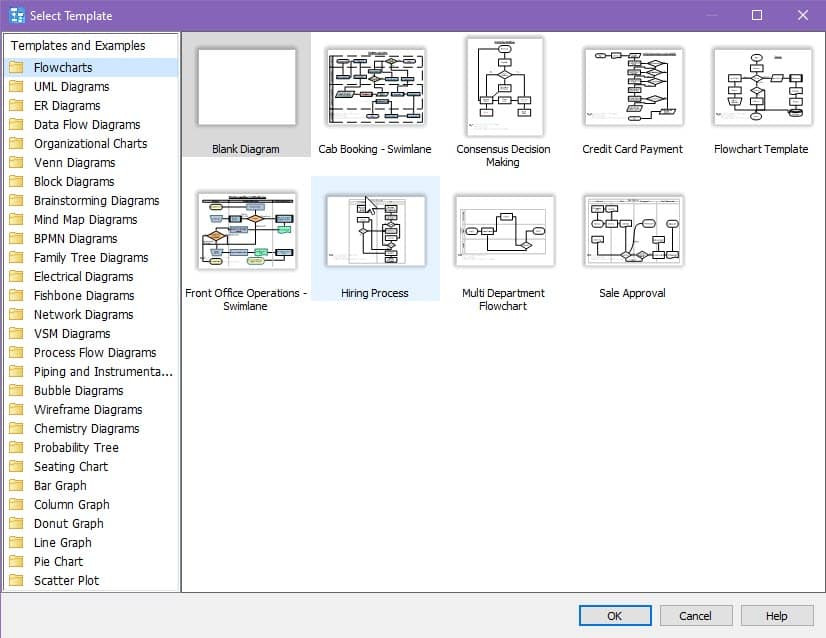
When I reviewed the tool, I found 21 types of diagrams. Some of the major ones include:
- Flowcharts: Eight diagrams, like cab booking, credit card payment, hiring process, etc.
- UML Diagrams: Three wireframes, like UML class diagram, UML activity diagram, etc.
- Data Flow Diagrams: Three samples, like elections, order processing, etc.
- Organizational Charts: Three options, like business, high school, etc.
- Venn Diagrams: Three designs, like marketing, academic, etc.
- Mind Map Diagrams: Ten diagrams, like career orientation, estate planning, mind map, etc.
- BPMN Diagrams: Four options, like billing, payroll, invoicing, etc.
When you choose a template, the app inserts a functional diagram inside the canvas area. Now, you simply need to edit the text.
A drawback of this feature is each time you want to load a template, you must download it.
Charts and Graphs
The app also lets you create charts and graphs for data visualization. Some of the options you have are as follows:
- Column graph
- Bar graph
- Pie chart
- Doughnut graph
- Line graph
- Scatter plot
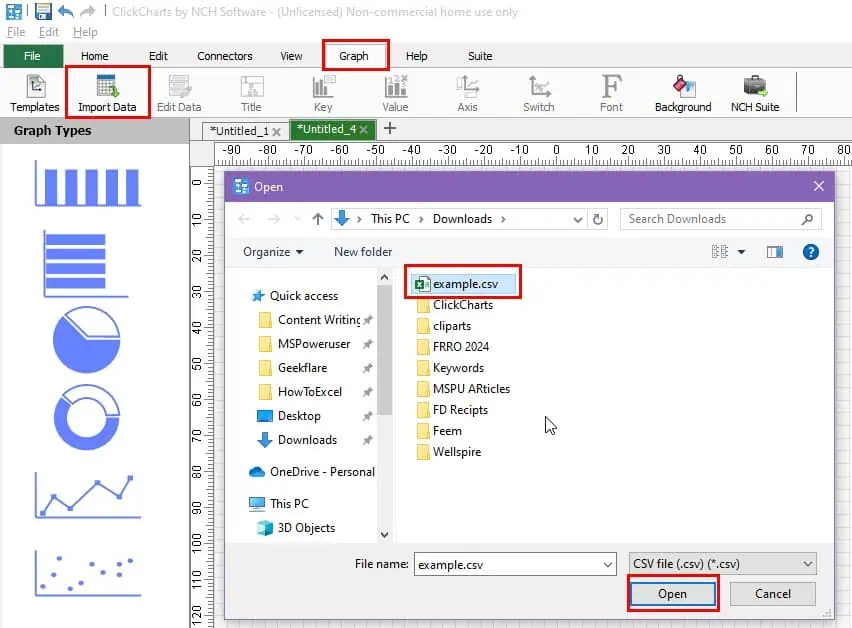
I found two different ways to plot my own data in the app to create a graph.
Firstly, I tried importing a CSV file containing the dataset I wanted to plot in a chart. As long as the organization of your dataset in the CSV file is as shown below, you’re good to go:
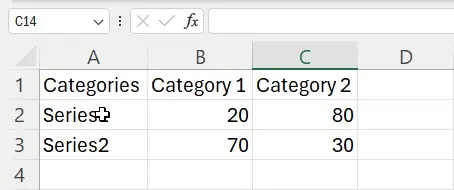
If your input CSV file isn’t in the format above, restructure the data before importing it to ClickCharts.
If the imported CSV file contains compatible datasets, the tool will automatically create a column graph.
If you find reorganizing the input CSV file a time-consuming task, don’t worry. You can use the second method to create a chart.
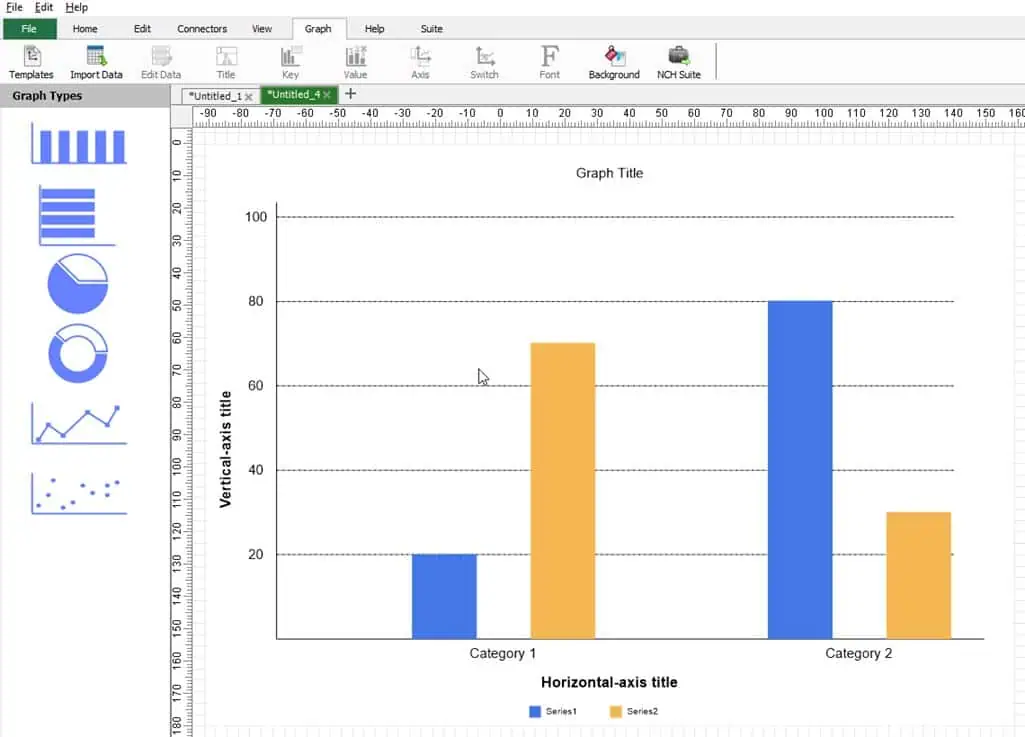
In this technique, you first choose a template graph from the left-side navigation panel of ClickCharts. Now, click on the canvas to add the chart. This is a dummy chart. It won’t contain your graph data.
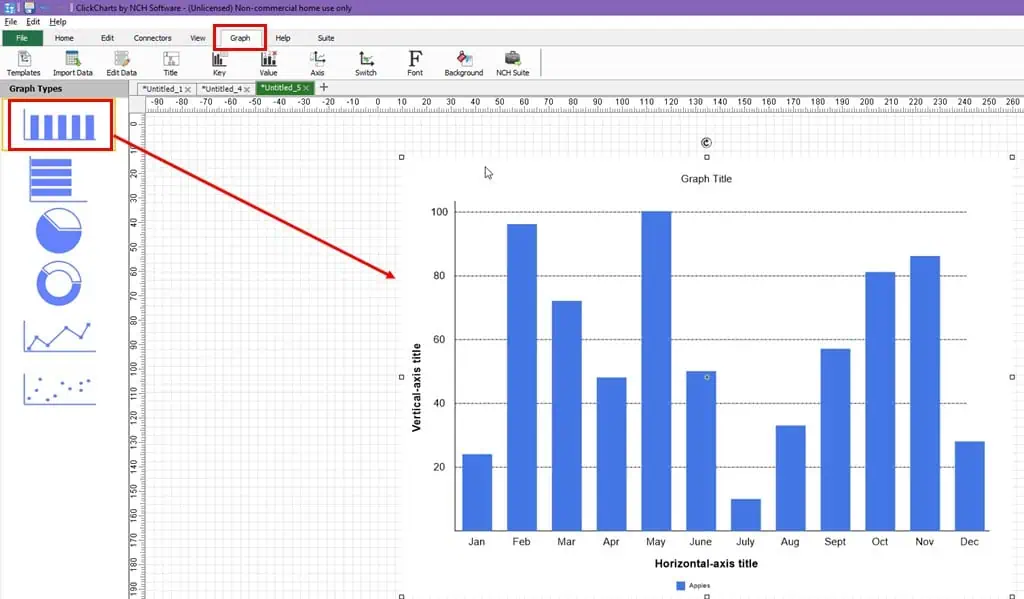
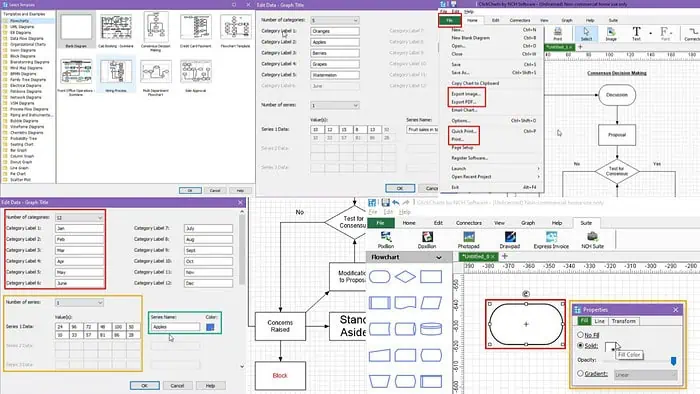
Then, you need to edit the underlying data of the chart to include your own data. For this, you can use the Edit Data button in the Graph tab.
You can now change the following to start modifying the dummy graph:
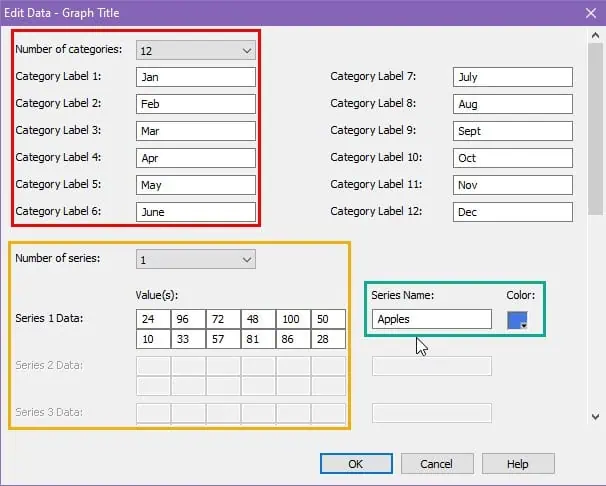
- Number of categories: Data points you need along the X-axis of the chart. It can be set maximum to 12.
- Category Label: Rename the data point names along the X-axis according to your own chart data.
- Number of series: These are the data points plotted along the Y-axis. Again, you can set up to 12 data points here.
- Series 1 Data: If there’s just one Y-axis series in your graph data, it’ll be represented as Series 1 Data. Enter the data point values in the relevant boxes.
- Series Name: Give a distinctly recognizable name for the Y-axis data series.
- Color: If you change this color code, the columns or lines on the chart for Series 1 Data will change accordingly.
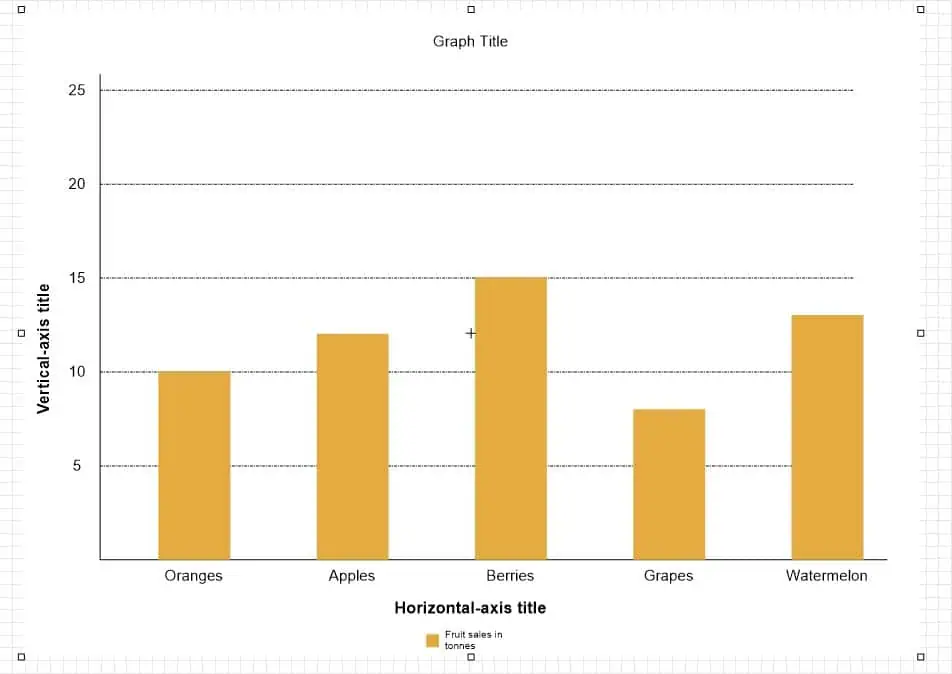
To test the feature, I customized the dummy column graph to plot the monthly sales of fruits in a produce business:
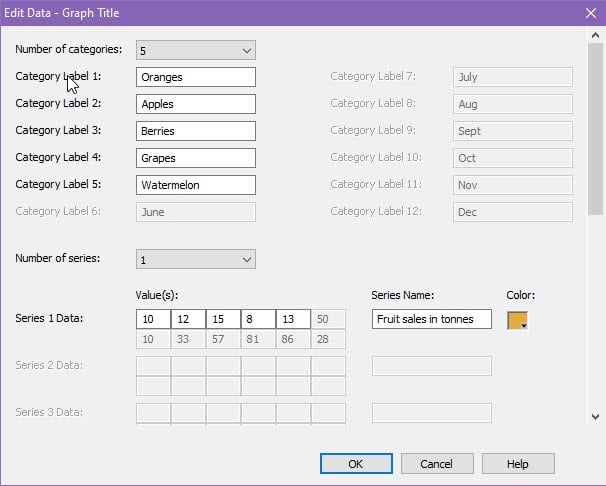
Here’s the personalized chart created by the app:
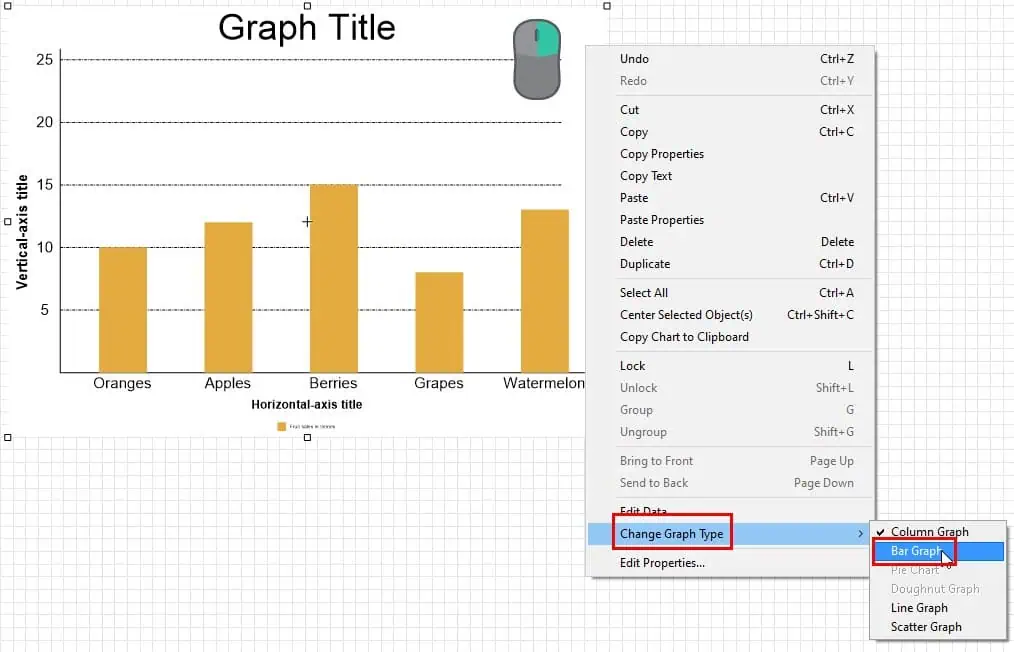
The tool also allows you to convert one data visualization type to another. Simply, right-click on the chart and hover the cursor over the Change Graph Type option on the context menu. Now, you can choose the new chart type from the overflow menu.
ClickCharts Snapping Modes
Aligning your symbols and connectors with the canvas grids and other objects is often challenging in most diagramming apps. ClickCharts resolved this by introducing the snapping tool.
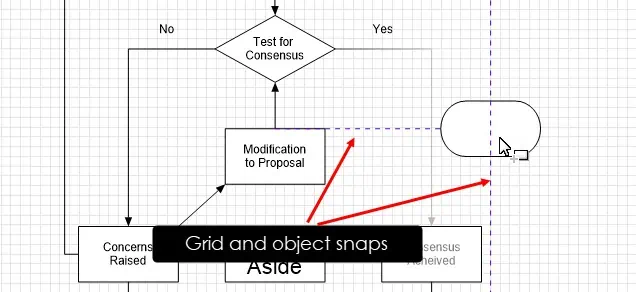
Snapping ensures that the symbols and other objects you place on the canvas align with pre-existing elements as well as with the gridlines.
The tool shows the alignment through dotted lines that overlay an object as you place it on the workspace. By default, you can see both the grid and object snapping lines.
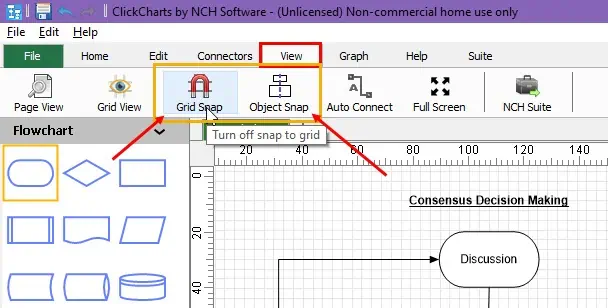
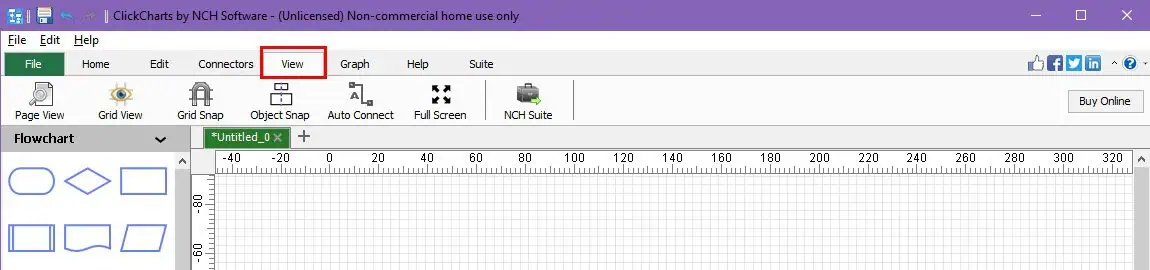
However, you can disable these features too. For that, you can go to the View tab and click on the options like Grid Snap and Object Snap to toggle Off and toggle On.
I usually keep these functions active for fine alignment of all the objects I place in my flowcharts. However, you can disable these functions to get more freedom in placing symbols and connectors.
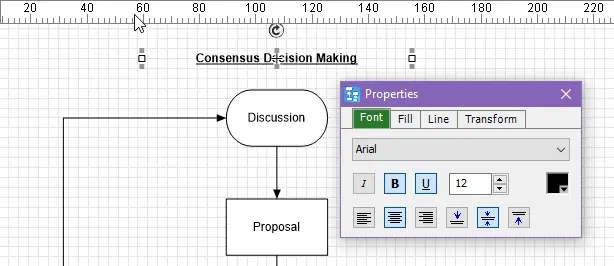
Ruler and Guides
You can find the tool ruler at the left and top edges of the canvas view. The unit of the ruler is in millimeters. For example, in the following screenshot, the distance between the two points is 20 mm:
For large diagrams, you sometimes need to create guide lines on the document to attach or snap the symbols to. These guide lines also help you to adhere to an aesthetical-looking and organized blueprint.
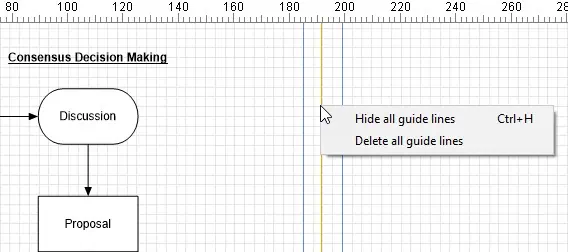
You can add as many of them as you want from the left-side ruler. Simply, click on the ruler to get a two-sided arrow. Now, drag the arrow cursor to the canvas space to see the thin blue-colored guide line. You can move it from left to right and vice versa using the left-click dragging movement.
To hide all guide lines, you can press Ctrl + H. To delete them, you can right-click on any of these and choose the Delete all guide lines option.
When you save or print the flowchart, the app doesn’t show the guide lines.
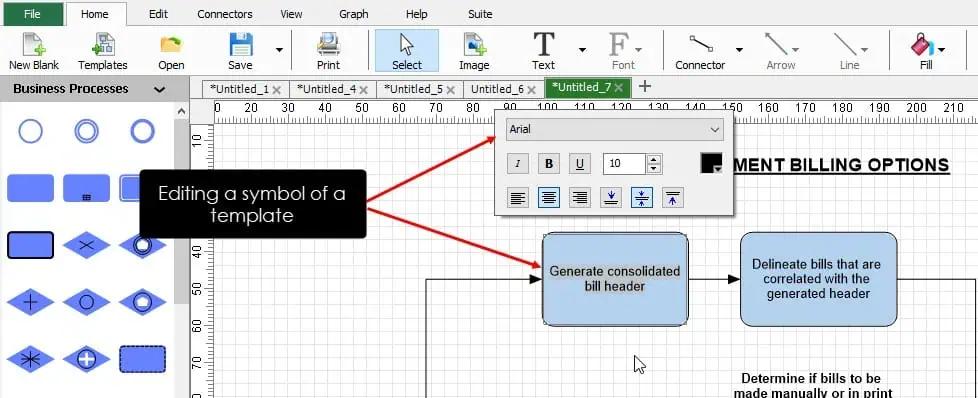
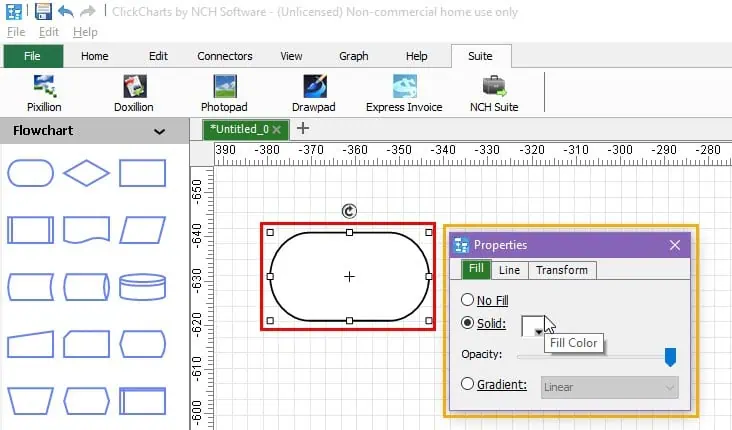
Fine Tuning of Object Properties
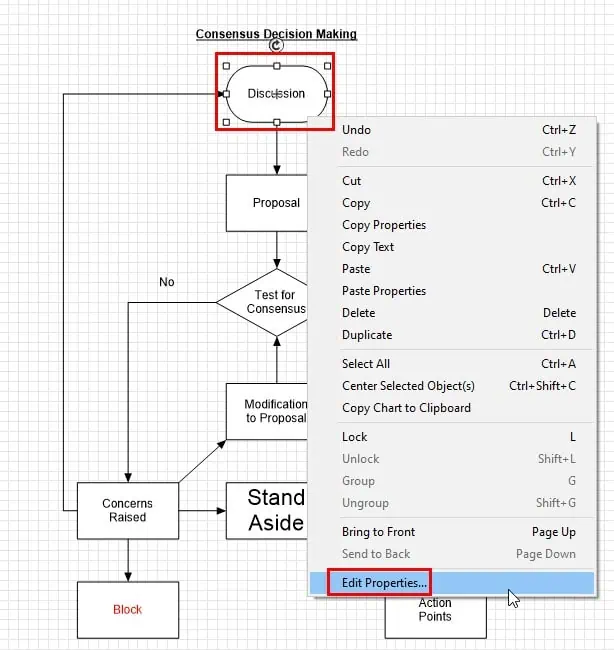
If you wish to customize all symbols and connectors to individual levels, you can use the Edit Properties feature.
First, you need to select the element you want to modify, right-click, and choose Edit Properties from the context menu to open the Properties dialog. The dialog menu options will change as you select different components.
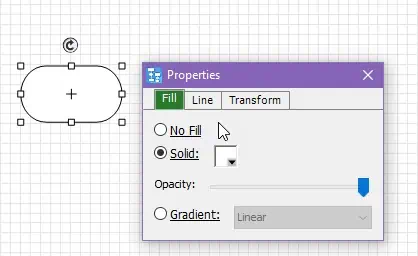
Find below the properties fine tuning you can perform:
- Symbols without texts: Fill, Line, and Transform
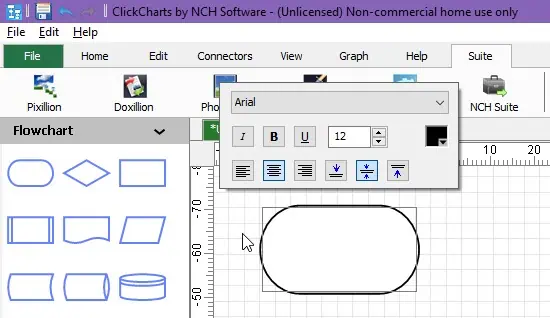
- Symbols with texts: Font, Fill, Line, and Transform
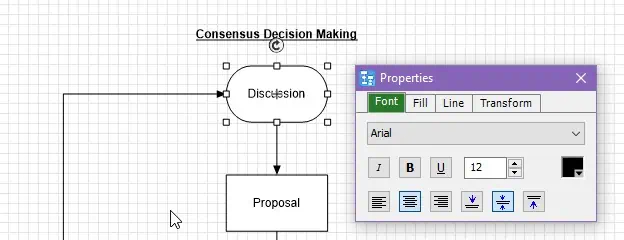
- Text boxes without symbols: Font, Fill, Line, and Transform
- Connectors: Line and Arrow
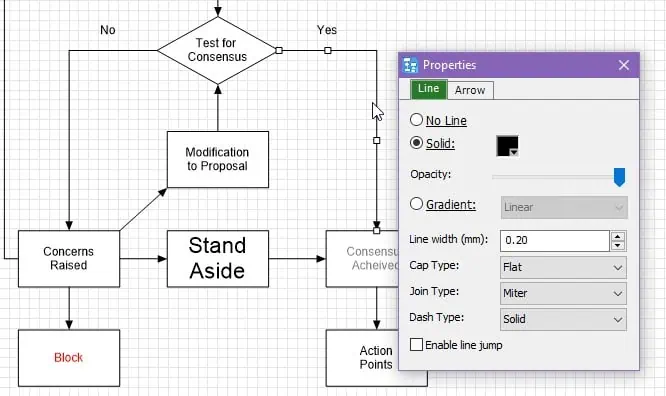
The changes you can make are as follows:
- Change the fill color of the symbols
- Modify the line color, change the line style, add line gradient, etc.
- Change the font type, color, bold, italics, underline, etc.
- Modify object or symbol rotation, position, and dimension
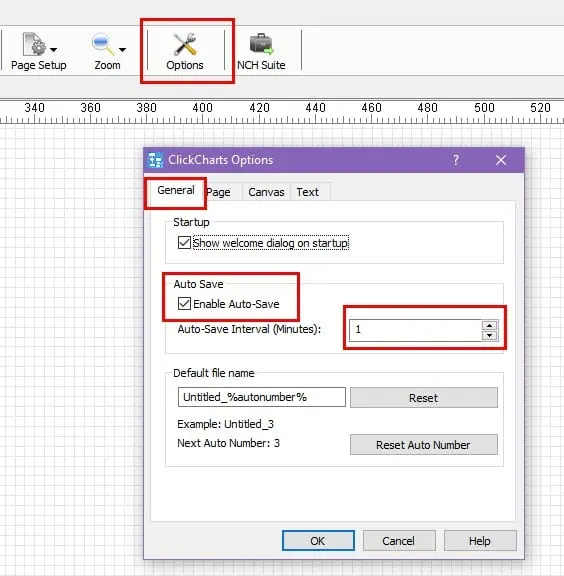
ClickCharts Auto-Save and Content Recovery
If you fail to save an ongoing ClickCharts project due to power failure or PC shutdown issues, you don’t need to worry. By default, the tool creates an autosave file for each open project.
If you save and close a project successfully, the app deletes the autosave file. However, if the app closes abruptly or your PC shuts down, the autosave file stays in the autosave folder.
The next time you open the ClickCharts app, it’ll automatically open all the projects kept in the autosave folder. The autosave file will only be deleted if you successfully save the projects using the File tab or by pressing Ctrl + S keys.
You can control the autosave feature from the Options dialog. It’s available in the File, Home, and Edit tabs.
Keyboard Shortcuts
I often use the app’s keyboard shortcuts to draw diagrams faster.
These shortcuts are spread around basic movements, diagram elements management, and adding popular elements. There’s a total of 79 of them
For example, you can use the hotkeys below to quickly add flowchart elements. This isn’t an exhaustive list. Find more shortcut keys on the official Keyboard Shortcuts portal.
- Fullscreen workspace: Alt + Enter
- Cancel current operation: Esc
- Text: T
- Filling Style: D
- Straight Connector: Shift + S
- Straight Yes Connector: Shift + Y (Flowchart must be selected)
- Electronic Information Connector: Shift + V (VSM Diagram must be selected)
Automate Chart Sharing Via Email
While reviewing the app, I discovered a great flowchart-sharing feature – Email Chart. It lets you automatically send a professional email message along with the flowchart as an attachment in PDF or CCD format.
The Email Chart option is available in the File tab.
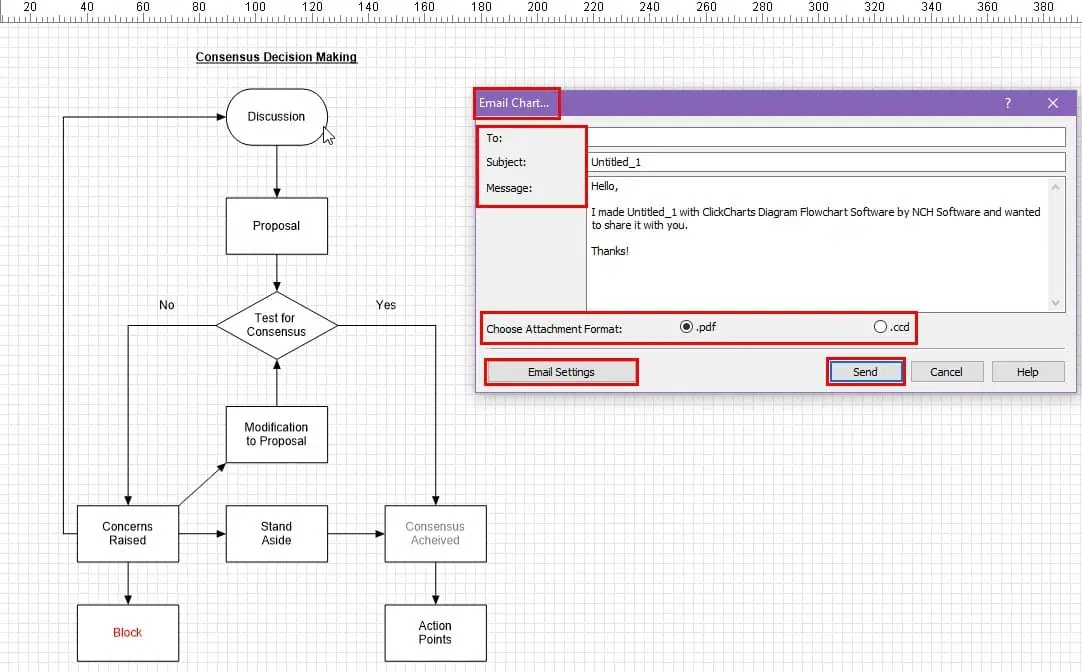
However, you must preconfigure this feature before you can use it effectively. These are the settings you can choose from:
- MAPI Protocol: Use this option if you’ve got a MAPI email app set up on your computer.
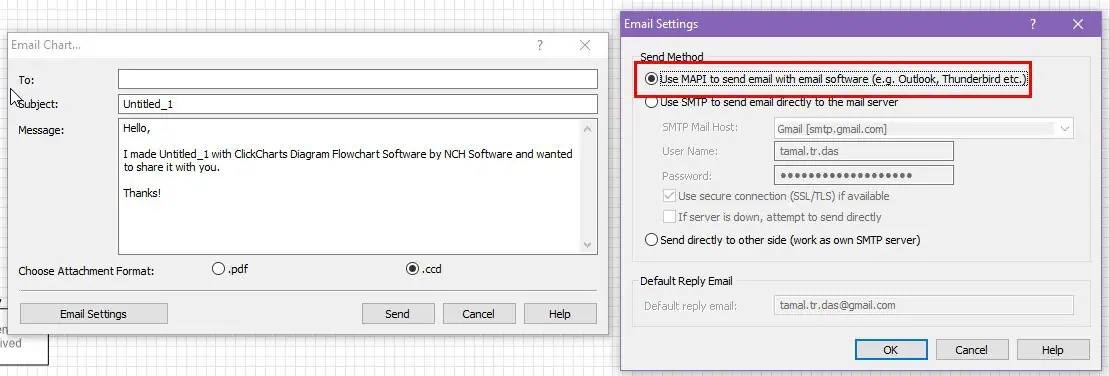
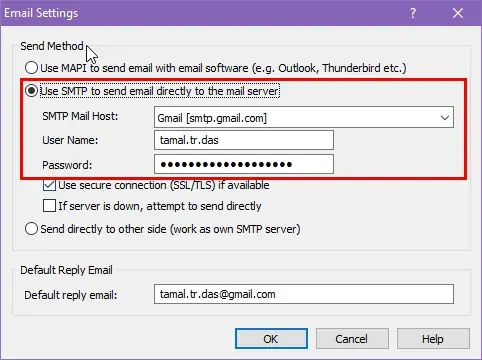
- SMTP Settings: You can set up an SMTP server using the Email Chart feature to send email automatically in one click.
Printing and Sharing
Once you’re done creating your flowchart, it’s time to get a simple file that you can share. ClickCharts offers digital and offline sharing options.
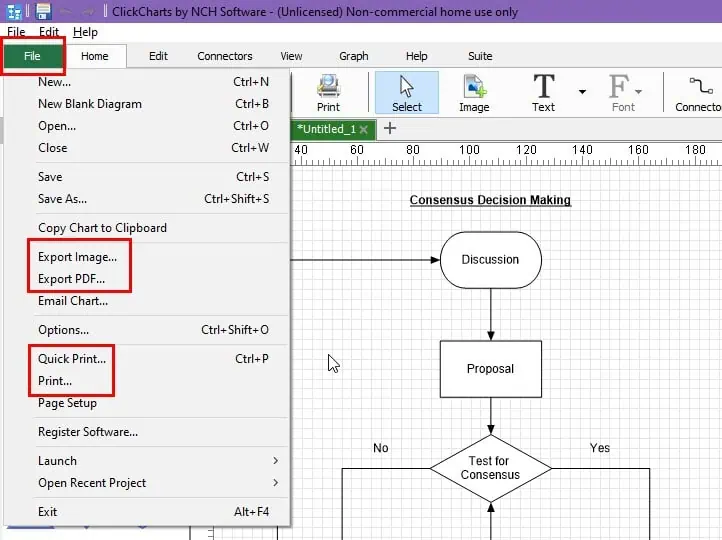
If you need to print the diagram on paper, you can use the Print option. You can find it in the File tab.
The primary Print function opens a Print Preview dialog. Here, you can choose from 11 different paper types, like A3, A4, Tabloid, etc. You can also switch between landscape and portrait printing.
If you often find diagrams aren’t printed on a page properly, ClickCharts resolves that by providing the Fit diagram to page option.
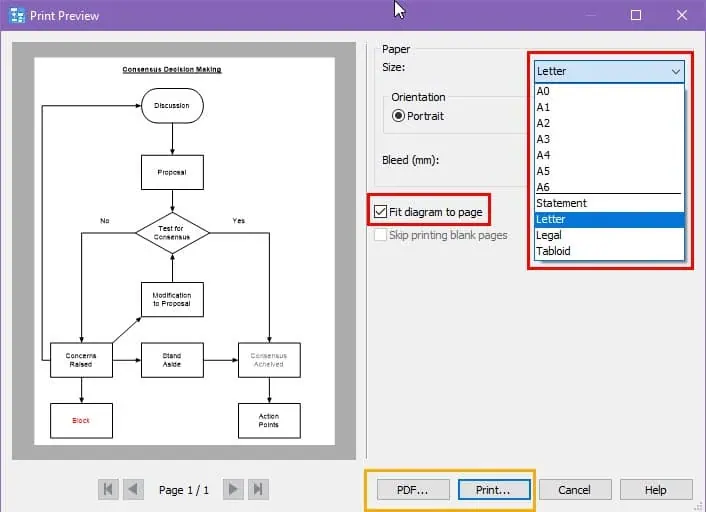
Now, you can continue printing on paper or virtually in PDF.
If you need a PNG or JPEG copy, you can use the Export Image or Save as options. Here, you can change the output file type to your preference to get a shareable copy of the diagram.
Mobile Apps
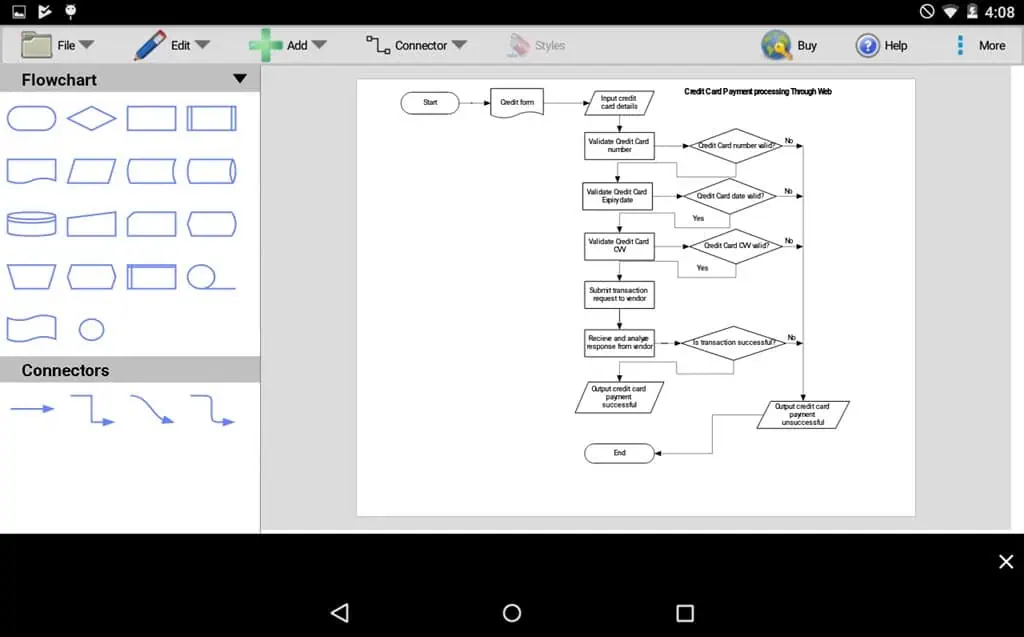
ClickCharts also comes for handheld devices like tablets running Android 5.0 and later versions. The mobile app includes most of the features you’ll find in the desktop version.
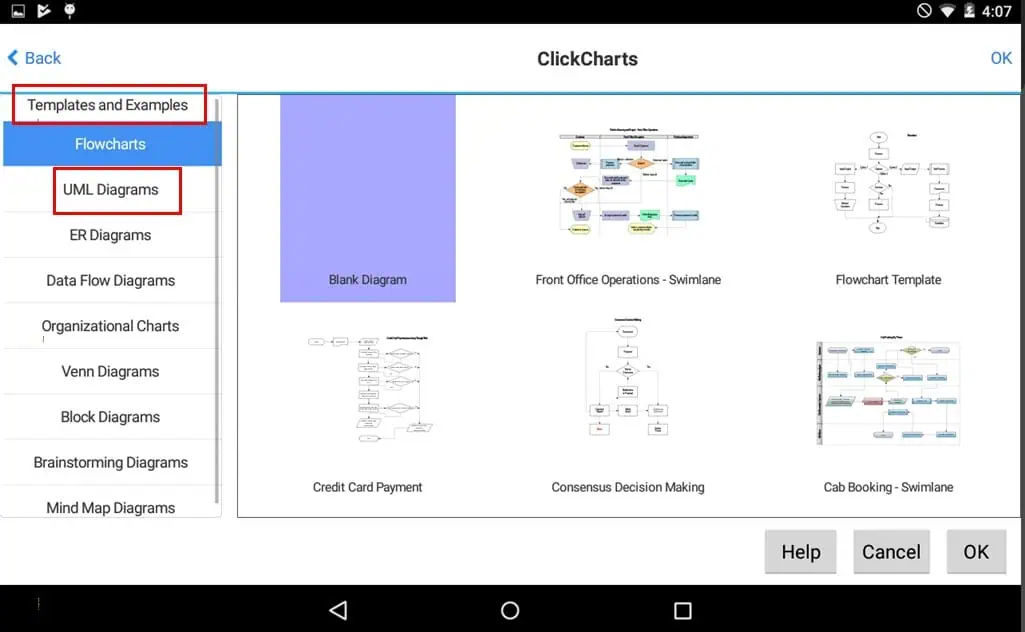
For example, you can open a template file from the Templates and Examples option on the mobile app. These are online templates and update quicker on an Android tablet than on desktop.
Other features available are Edit, Add Elements, Connector, Styles, etc. In a nutshell, the mobile app offers enough functionalities so you can create professional flowcharts on the go.
Except for template library updating, the ClickCharts mobile app doesn’t require an internet connection for flowchart designing, downloading, and saving.
When compared with one of its competitors, Lucidchart, ClickCharts lacks a multi-device content syncing function. If you use Lucidchart on a mobile device and create a flowchart, you can access the content from a desktop in real-time.
Moreover, Lucidchart is available for all iOS (iOS 13.0 or later) and Android (8.1 and newer) devices, irrespective of the device type, like tablet or smartphone. Contrarily, ClickCharts only supports tablets running the Android Lollipop OS.
ClickCharts User Interface
I won’t sugarcoat the fact that diagramming apps come with an exhausting user interface. ClickCharts isn’t any different. You’ll need to invest some time in getting used to it.
However, the software is clutter-free compared to its competitors like Lucidchart. If you check out the user interface of the latter, you’ll see options and buttons are everywhere:
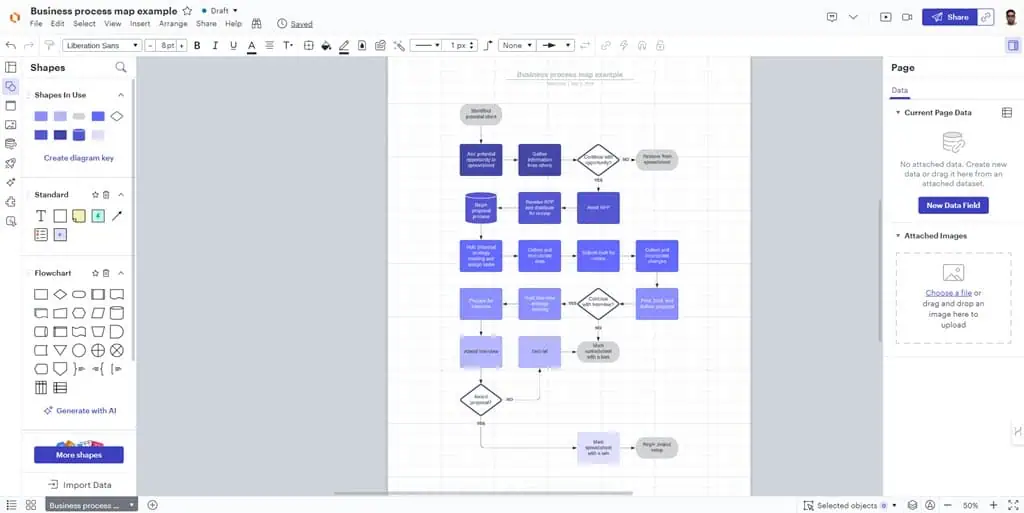
Also, the functional buttons of the Lucidchart app are tiny. Not to mention, most of the buttons only show a visual diagram or icon. It lacks enough expression for the function the icons represent.
You won’t face such an inconvenience with the ClickCharts app though:
Firstly, when you run the app, the tool shows a Welcome Screen for a few mostly used options as outlined below:
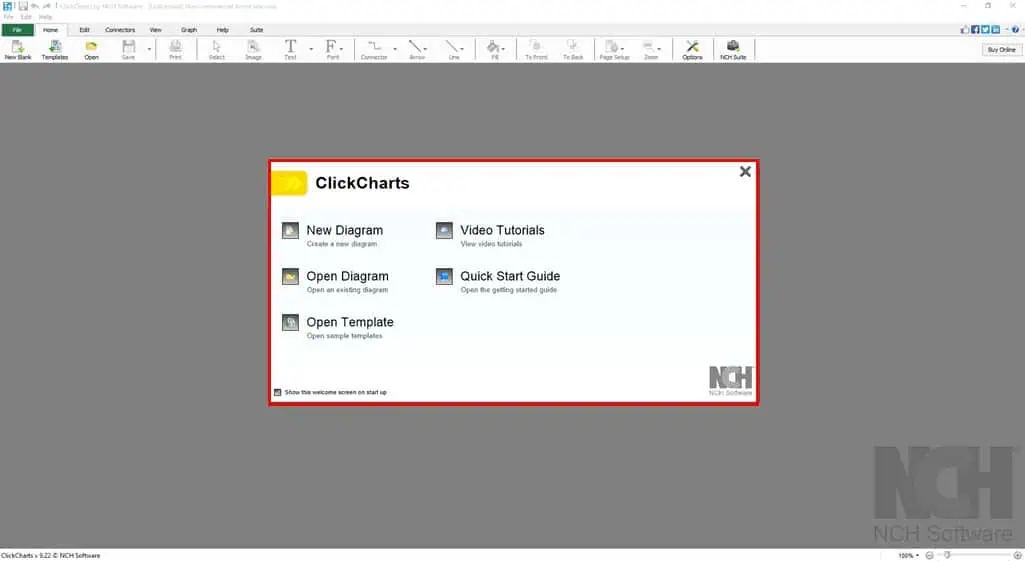
- New Diagram: It lets you open a blank grid map where you can draw a flowchart from scratch or open a template and personalize that.
- Open Diagram: If you’ve got an existing ClickCharts flowchart file, you can open that using this option.
- Open Template: If you’re a beginner-level flowchart maker or just getting started with the app, you should use the template library.
- Video Tutorials: This option takes you to the video walkthrough portal of the software.
- Quick Start Guide: It’ll redirect you to a website where you can find all technical and instructional documents.
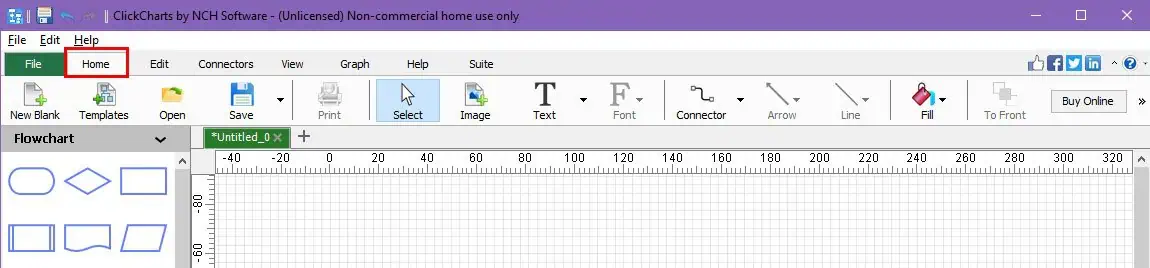
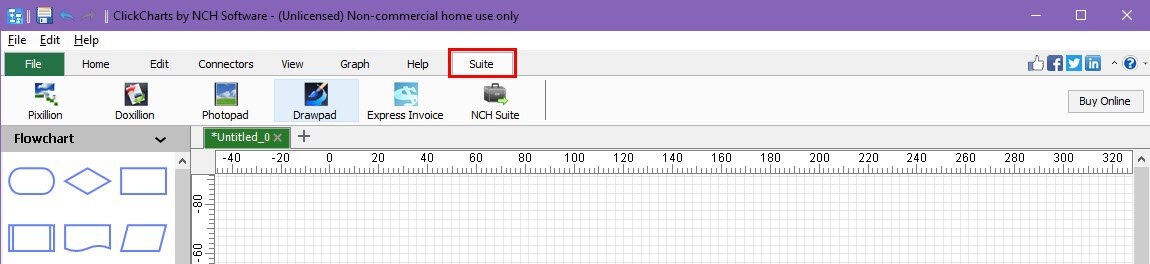
Now, coming to other major UI elements past the Welcome Screen, there are only eight tabs on the top menu bar. These are as outlined below:
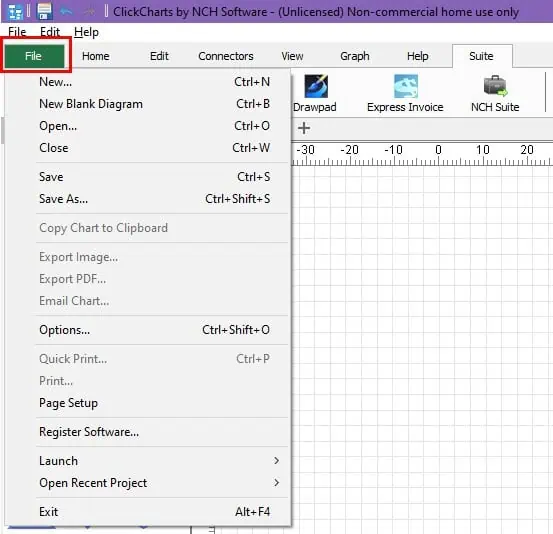
- File: It’s for accessing old files, saving current flowcharts, exporting diagrams as a different file, print setup, page setup, sending emails, etc.
- Home: This tab has the commonly used functions like New Blank, Templates, Open, Save, Text, Font, Connector, Fill, Page Setup, Options, and more.
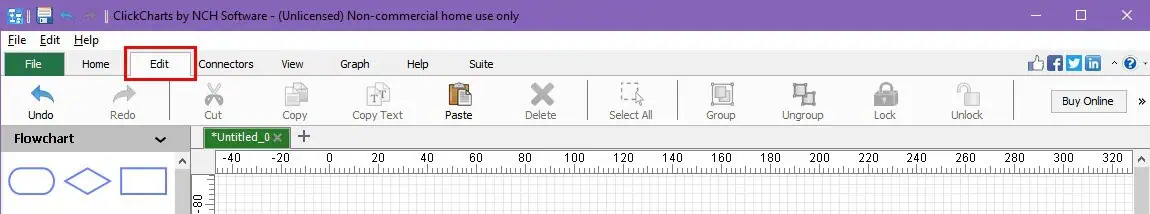
- Edit: The functions of this tab will only become active when you create a minimal flowchart. It mainly provides the options to change the diagram elements using Cut, Copy, Copy Text, Paste, Delete, Group, Add Anchor, etc., tools.
- Connectors: This tab provides all sorts of flowchart connectors you can use in this tool along with their style customization options.

- View: Using the options in the View tab, like Page View, Grid View, Grid Snap, Auto Connect, etc., you can change how the project space looks.
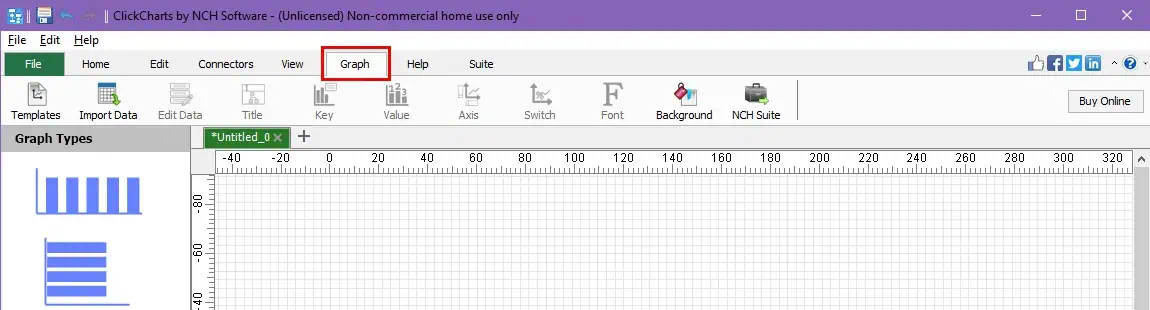
- Graph: This tab lets you access all the software features related to chart-making from numerical datasets. You can also customize the series, chart titles, datasets, visuals, etc., to make your charts better than the default styles.
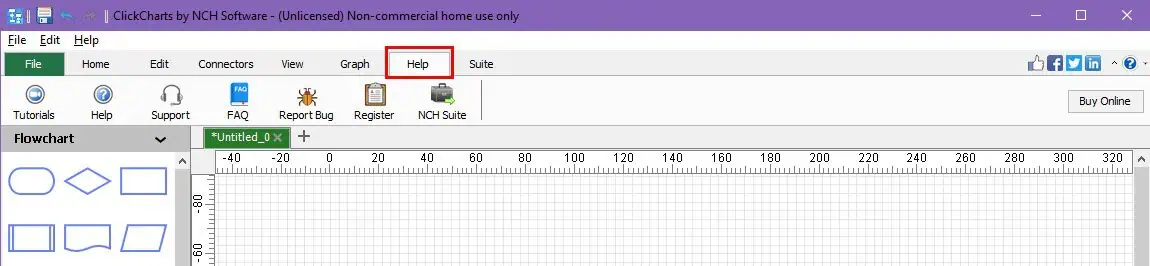
- Help: This tab shows all the help and support resources you can use to learn the tool or fix any issues.
- Suite: You’ll rarely use the functions in this tab. Basically, you can download all other related NCH Software apps from this section.
Now, coming to the canvas navigation, it offers intuitive and fast movement actions like:
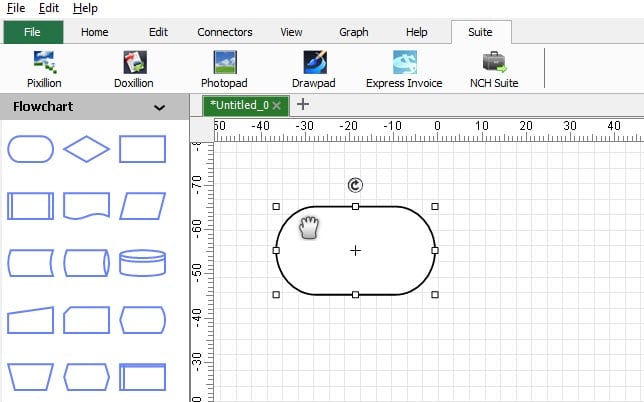
- Drag and drop moves: You can click on any item on the diagram and move it on the canvas by dragging the mouse in the target direction. You must keep the element clicked or selected when moving.
- Add text: Simply double-click inside a shape to add text.
- Canvas pan: By pressing the Space Bar along with mouse click and drag, you can pan the canvas to the left, right, up, and down. This helps you visualize large and expansive diagrams on a small screen.
- Zoom in and out: Simply pressing the Ctrl key and scrolling the mouse wheel will enable you to zoom in and out of the canvas.
- Horizontal scroll: You can press the Shift key and turn the mouse wheel to scroll the canvas left to right or vice versa.
- Vertical scroll: When you just scroll the mouse wheel, the canvas will go up or down vertically.
You don’t need to remember all these moves, though. You’ll see instructions at the bottom of the canvas. This is where its competitors lose. For example, Lucidchart also supports some of these movements but doesn’t guide you.
Sometimes, you may feel overwhelmed when looking for a specific function of a diagramming element. To avoid such confusion and distraction, ClickCharts offers a Right-Click Properties option, which brings out a context menu.
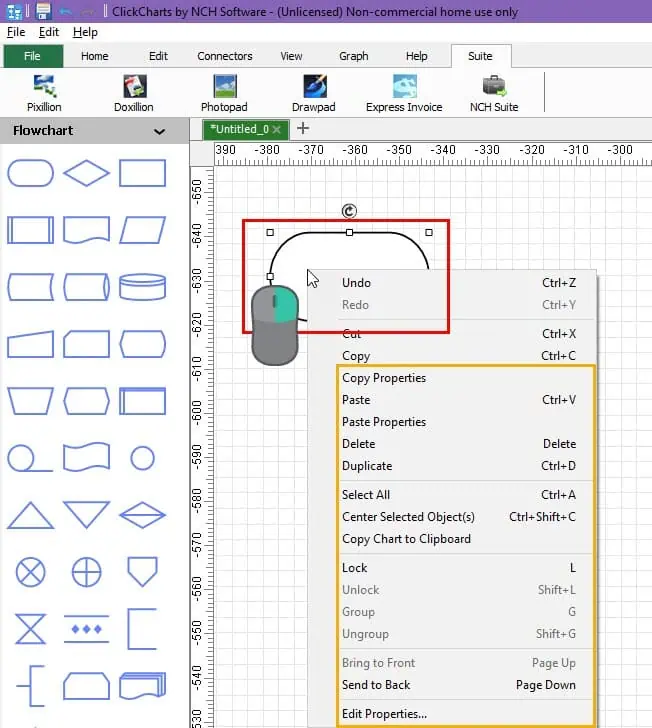
There, you find advanced options like moving one element behind another or placing it above it, plus undoing, redoing, centralizing, and more.
Also, from here, you can access the Edit Properties menu. It shows all possible customizations like Fill, Line, Transform, and more. The Edit Properties dialog will always show all related customizations of an element. It’ll change if you select another component.
So, now you see that the tool’s user interface is fairly easy. Also, there are enough user-friendly options in place to ensure the UI doesn’t become a barrier to effective diagramming.
ClickCharts Customer Support
ClickCharts offers extensive self-help resources. You can use those to resolve diagramming and technical issues.
If you go to the Help menu within the app, you’ll find the following DIY support materials and documentation:
- Tutorials: It’ll take you to the Charting Software Videos portal where you can watch YouTube videos explaining the app’s functionalities.
- Help: This option will redirect you to a webpage containing technical and user manual documentation for all the features of ClickCharts.
Discussion Forum
You can access the ClickCharts forum for free. It’s not mandatory to buy a paid license to use this support resource.
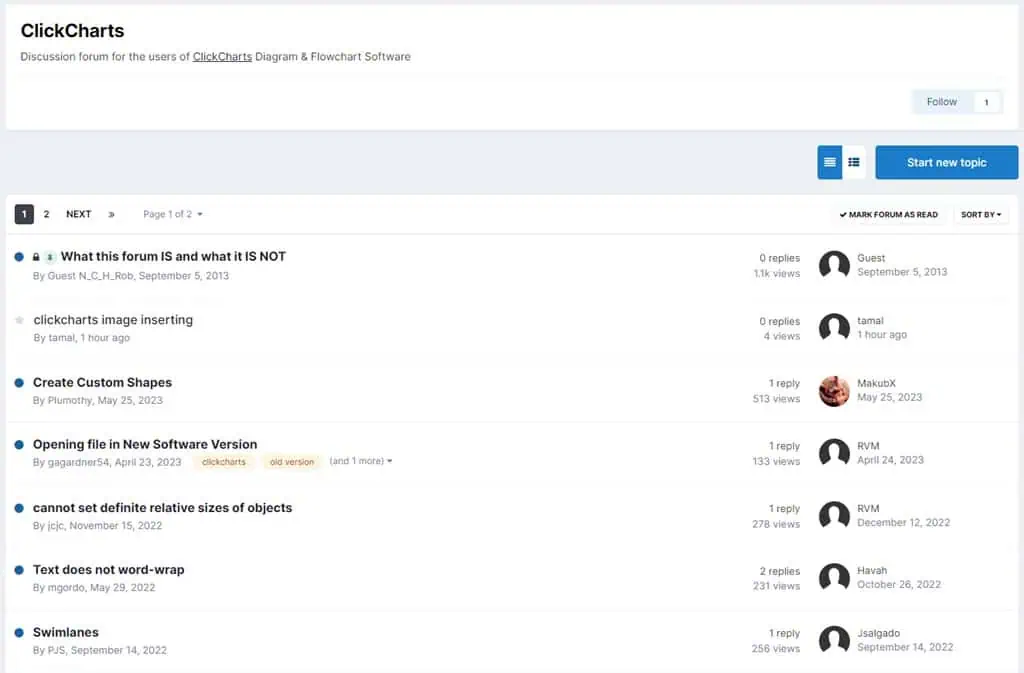
You can create a new topic as shown in the screenshot below. You can also describe the issue you’re facing and attach images if needed.
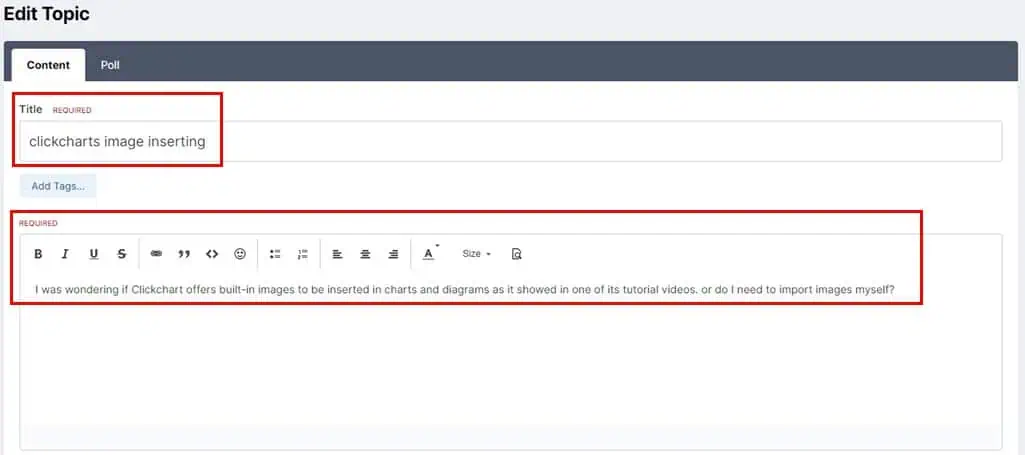
A ClickCharts specialist or user will respond to your query. There’s no guaranteed time frame by which someone will respond to your question in the forum.
I’ve submitted a forum ticket when reviewing the tool. I didn’t receive a response for 3 days.
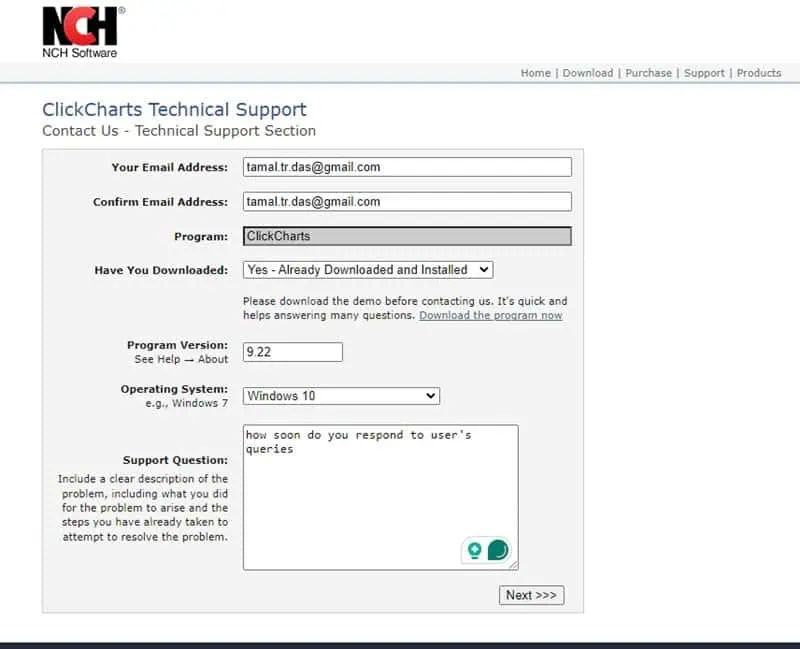
ClickCharts Technical Support
If you want to get expert assistance from ClickCharts, you can use the Support (headphone) icon in the app’s Help menu.
It’ll open an online form to enter details like:
- Your Email Address
- Confirm Email Address
- Program – auto-selected to ClickCharts
- Have You Downloaded
- Program Version
- Operating System
- Support Question
To test if the system works, I submitted the following form:
Once you send the form, you’ll get an acknowledgment as shown below:
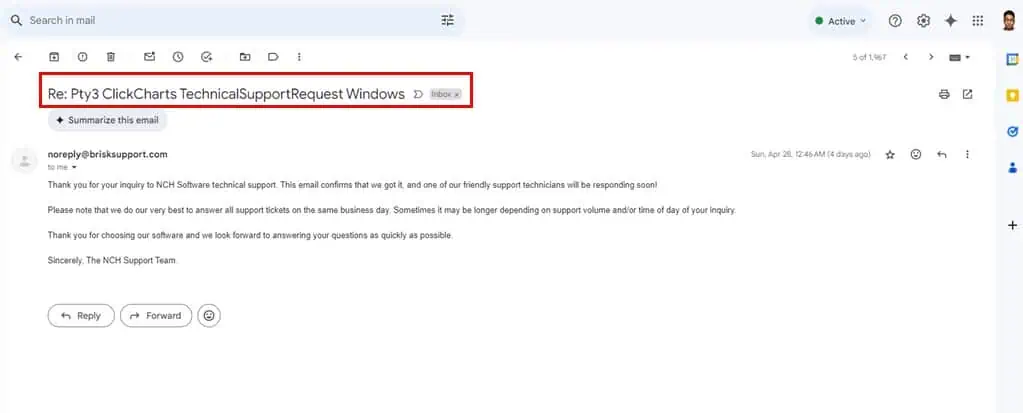
It’s been five days and I still haven’t received a response. You might have better luck in receiving a support response if you buy a paid license from ClickCharts.
ClickCharts Pricing
Find below a simple pricing table for ClickCharts license purchases:
| Subscription Model and Costs | Features |
| Pro Edition Annual Plan for $60/ year | Single installation license; business and commercial usage are allowed. |
| Home Edition Annual Plan for $50/ year | Unlimited use for non-commercial purposes. |
| Pro Edition Quarterly Plan for $3.33/ month but billed $9.99/ quarter | Pro features with commercial usage. |
If you buy any of the above subscription plans as a United States resident, you don’t have to pay anything extra toward sales tax. However, if you buy as a foreign buyer, a sales tax might apply depending on your country’s sales tax, VAT, GST, etc., rules.
I couldn’t find any refund policy for ClickCharts. So, I suggest downloading the free version, using it for a few projects, and buying a paid license only if you like it.
Keep in mind that all subscriptions are subject to auto-renewal. Usually, you’ll have to submit a support ticket to cancel the subscription if you don’t want to continue the next billing cycle.
But as we discussed, NCH Software’s support team isn’t the most reliable. If you don’t get an answer I suggest you remove your payment method from the website.
ClickCharts Review – Verdict
I’d vouch for the ClickCharts diagramming app if you need it for home and school use. You can get it for free and use it on as many devices as you’ve got. It’s simple, easy to learn, and comes with a lot of templates you can use for free.
I’ll suggest you go for it for business or agency use only if you can compromise on the following features:
- Collaborative online editing
- Access control
- Version control
- Online sharing via URLs
- Expansive templates and symbols library
- Enterprise-grade encryption for online usage
Whether you use it in an individual or business capacity, customer support may be unreliable. So, you must be prepared for self-service troubleshooting or waiting a long while for a reply.
So, did this ClickCharts review help you make a decision? Let me know in the comments!
Read our disclosure page to find out how can you help MSPoweruser sustain the editorial team Read more
Improve this guide
User forum
0 messages