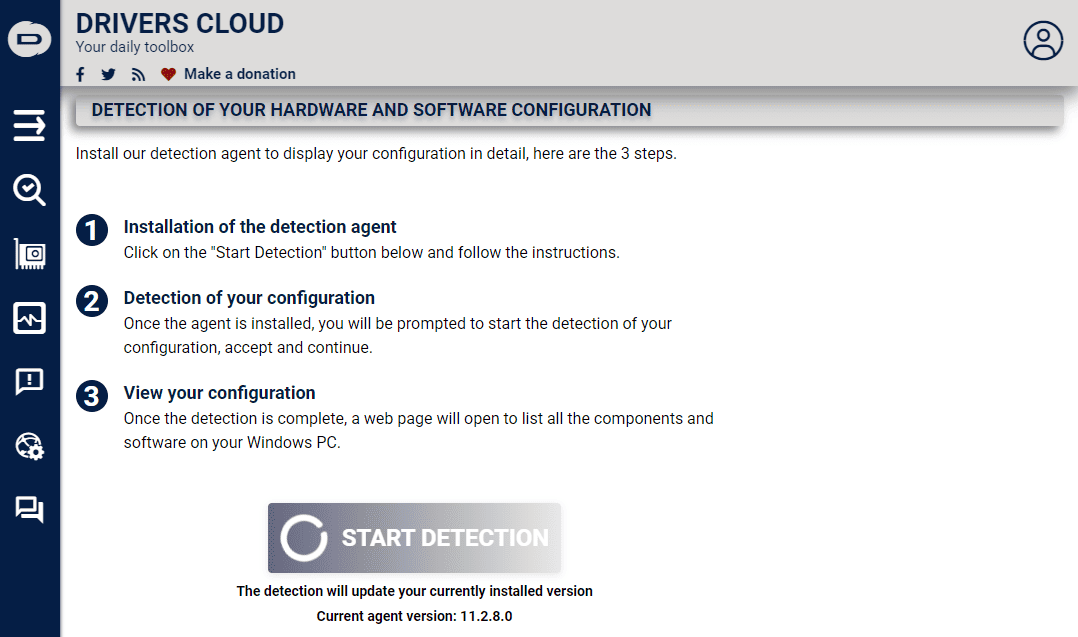
Top 10 User-Friendly PC Diagnostic Tools for a Full Hardware Test
Choosing the best hardware diagnostic tool can make a massive difference in your ability to manage your device. Whether you face issues with your device’s hard drives or slow performance and freezes, this software can help.
I tested more than 25 hardware diagnostics tools to choose 10 of the best options on the market. Below, you’ll also see a detailed description of my testing process.
How I Chose the Best Hardware Diagnostic Tool
- I started by researching various hardware diagnostic tools and identifying the most useful ones.
- I downloaded and installed each software option and tested their compatibility with various Windows-based systems.
- I explored the features, writing a short sketch about each, including real-time monitoring, stress testing, etc.
- I navigated the interfaces of each software to ensure user-friendliness.
- I researched reputable online sources for reviews and ratings.
- I tested each tool’s capabilities to evaluate performance and data accuracy.
- Finally, I looked at the level of support each company provides and update frequency.
| Software | Performance | Accuracy | Ease of Use | Features | Reliability |
|---|---|---|---|---|---|
| AIDA64 Extreme | 5/5 | Highly accurate | 5/5 | Comprehensive feature set | Reliable diagnostics |
| MiniTool Partition Wizard | 4/5 | Accurate partition info | 5/5 | Partition management | Reliable for disk tasks |
| Speccy | 3/5 | Generally accurate | 5/5 | Basic feature set | Reliable for basic info |
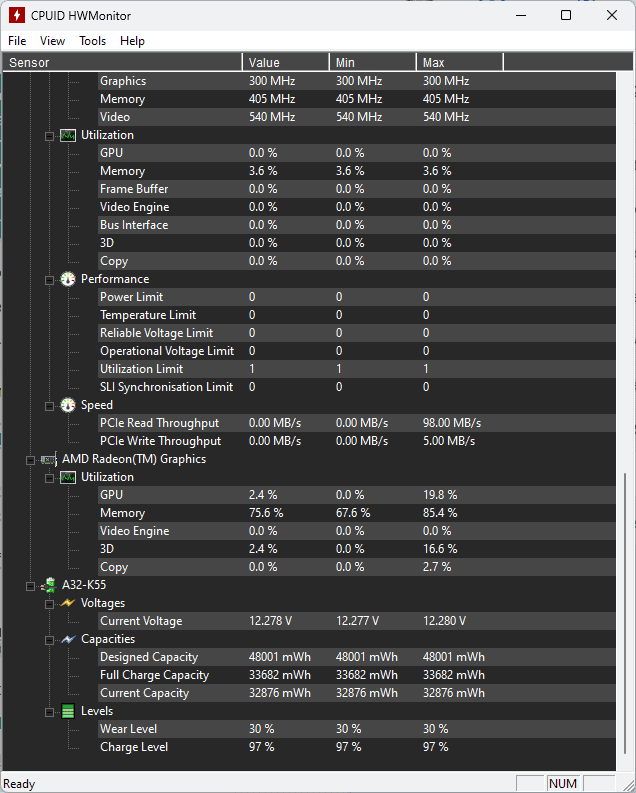
| HWMonitor Pro | 4/5 | Accurate readings | 5/5 | Real-time monitoring | Stable and dependable |
| Open Hardware Monitor | 3/5 | Accuracy may vary | 5/5 | Basic monitoring features | Depends on system support |
| CPU-Z | 3/5 | Accurate information | 4/5 | Focuses on CPU details | Reliable CPU diagnostics |
| MSI Afterburner | 4/5 | Accurate GPU metrics | 3/5 | Overclocking and monitoring | Highly reliable for GPUs |
| CrystalDiskInfo | 3/5 | Accurate disk data | 5/5 | Disk health monitoring | Dependable disk diagnostics |
| Intel Processor Diagnostic Tool | 3/5 | Accuracy in diagnostics | 2/5 | Focuses on CPU diagnostics | Reliable for Intel CPUs |
Best Hardware Diagnostic Tool – Top 10 Options for Hardware Test
These services are perfect for a comprehensive PC hardware check:
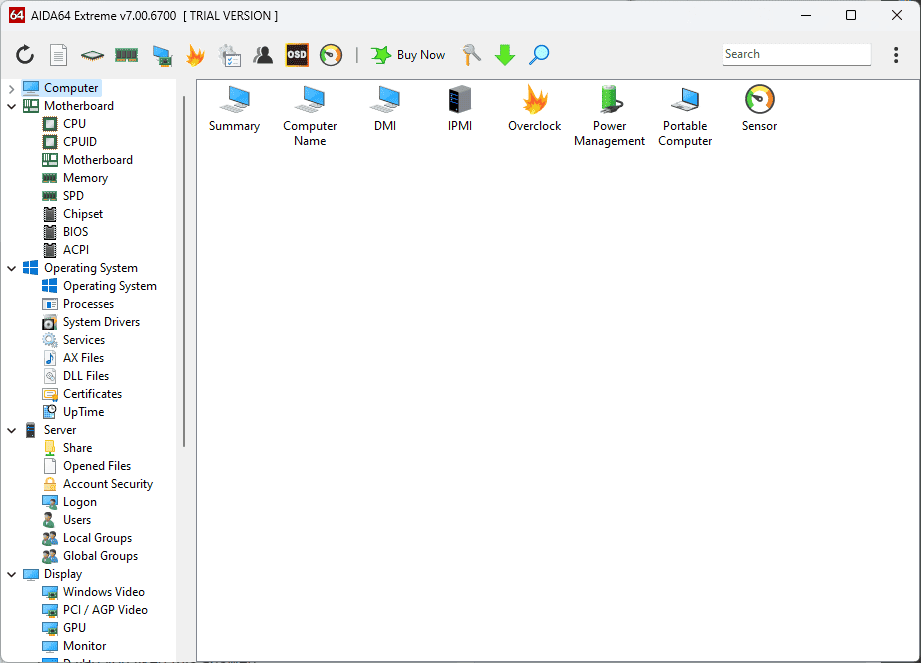
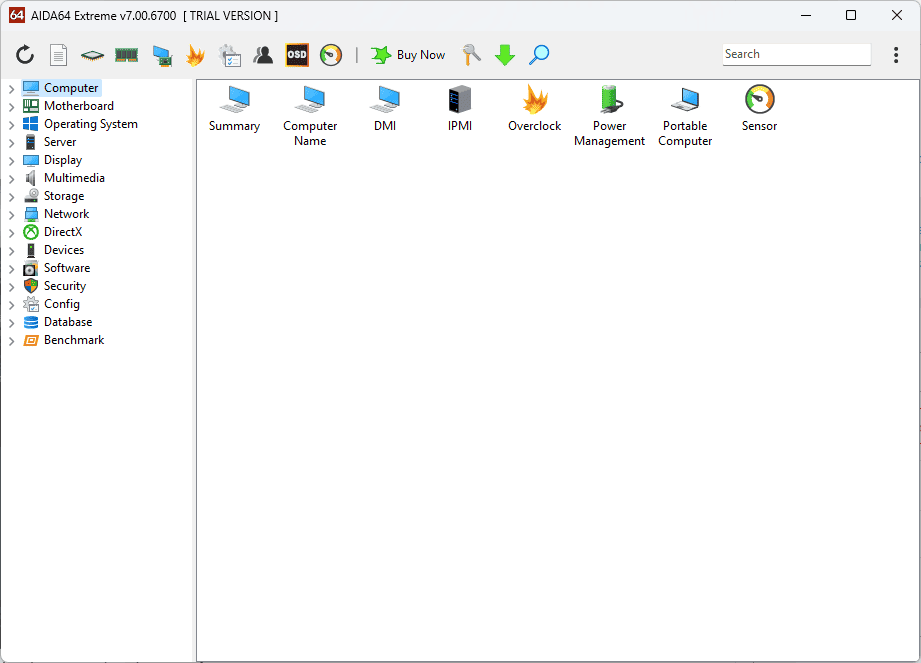
1. AIDA64 Extreme
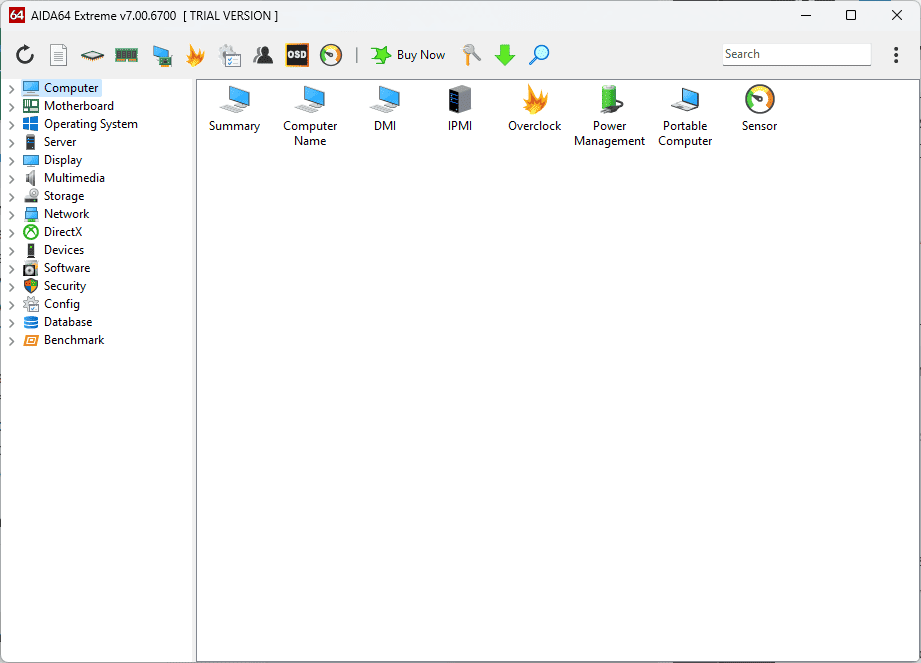
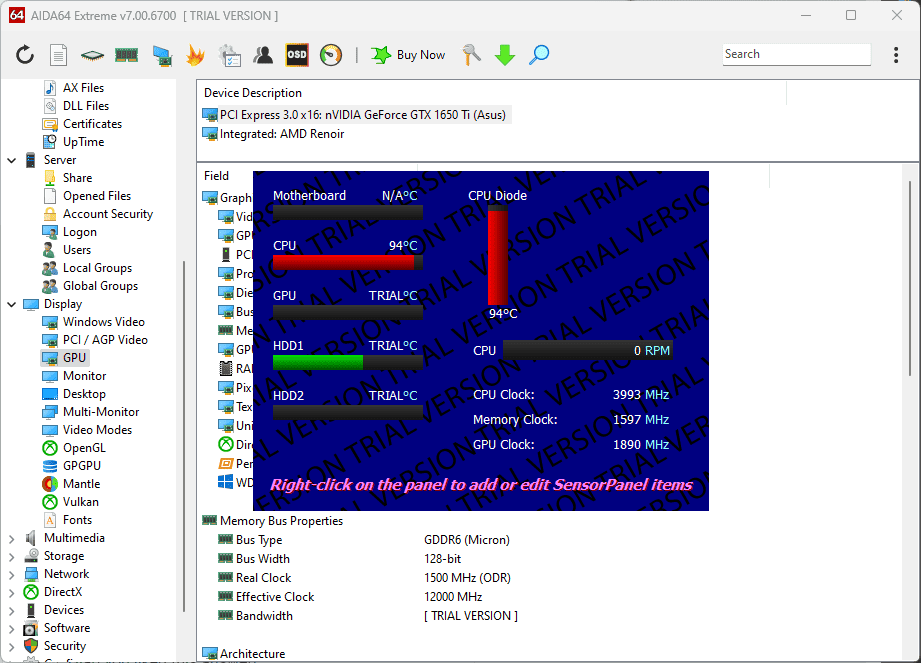
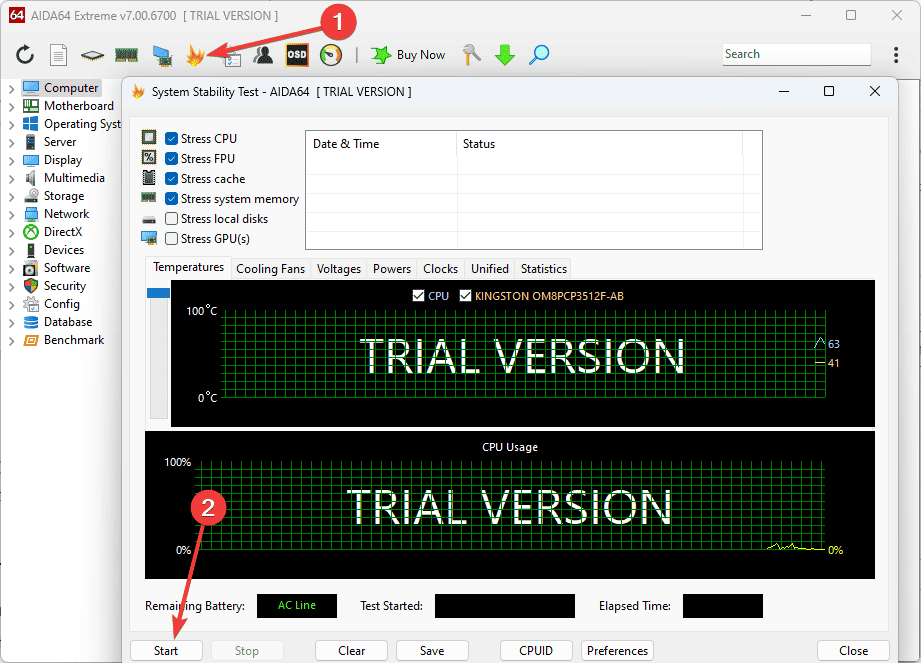
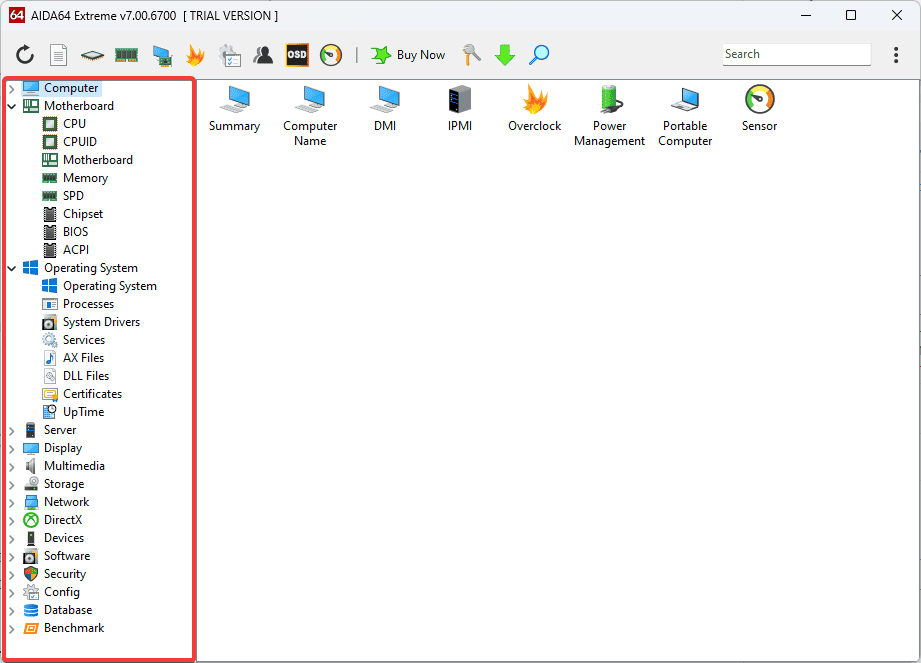
As soon as I opened AIDA64 Extreme, I was surprised by the range of information that it presented me with. It offers a full set of diagnostic tools in a computer. The installation process went smoothly, and no bloatware or ads were present.
What stood out for me during my testing were the real-time tracking capabilities.
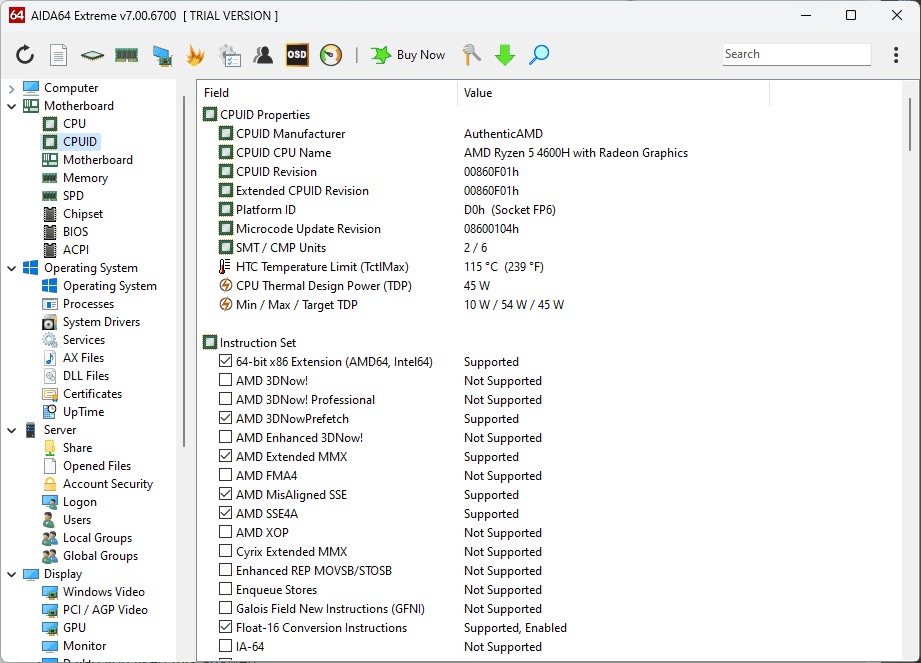
These options give me an in-depth overview of system temperatures, voltages, and fan speeds.
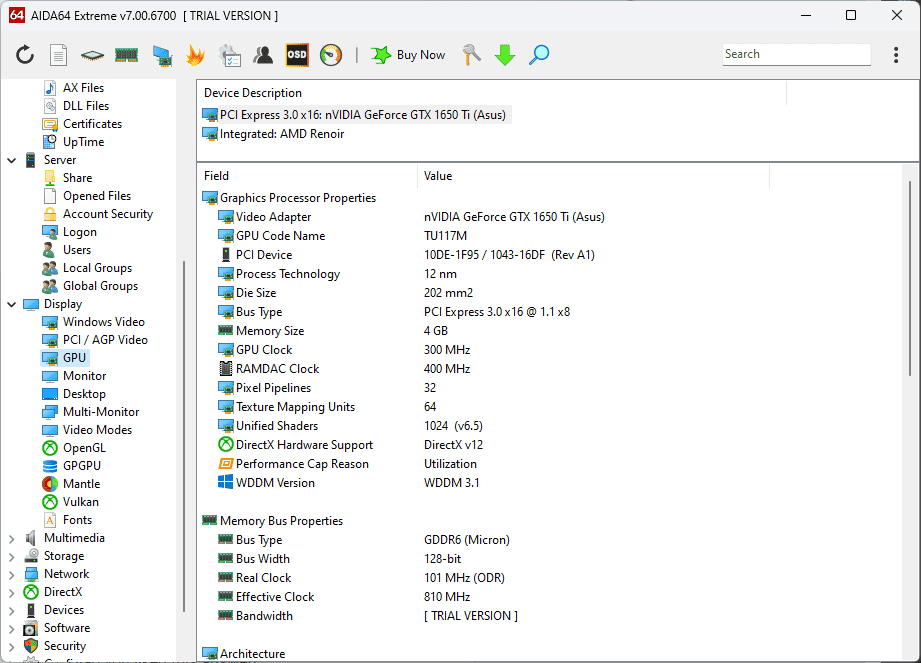
The stress test module was also very useful, as I tried it before playing some of my favorite games. I also tried the built-in GPU testing tool.
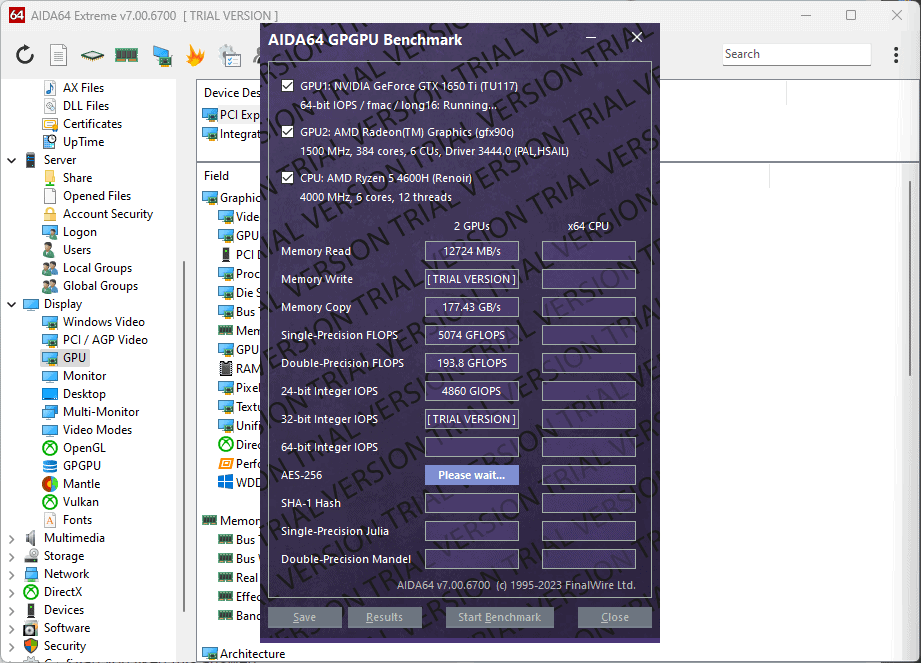
Still, the interface can be overwhelming for beginners, as the data might not make complete sense.
There’s nothing a bit of online research can’t fix, though.
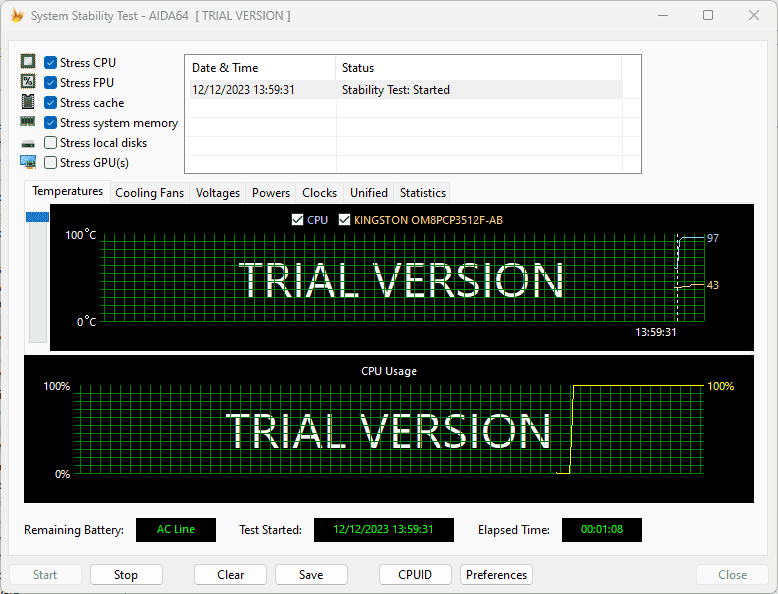
However, it didn’t include a 3D benchmarking tool which might disappoint gamers.
Pros:
- Offers some excellent options covering a wide range of PC elements
- Has performed optimally on varied configurations
- Provides detailed information
- Real-time tracking feature for temperatures, voltages, and fan speeds
- Low impact on system resources, even when benchmarking
Cons:
- It doesn’t include a 3D benchmarking tool
- The interface can be a bit too complex for beginners
- It’s pretty pricey, especially if used for overclocking
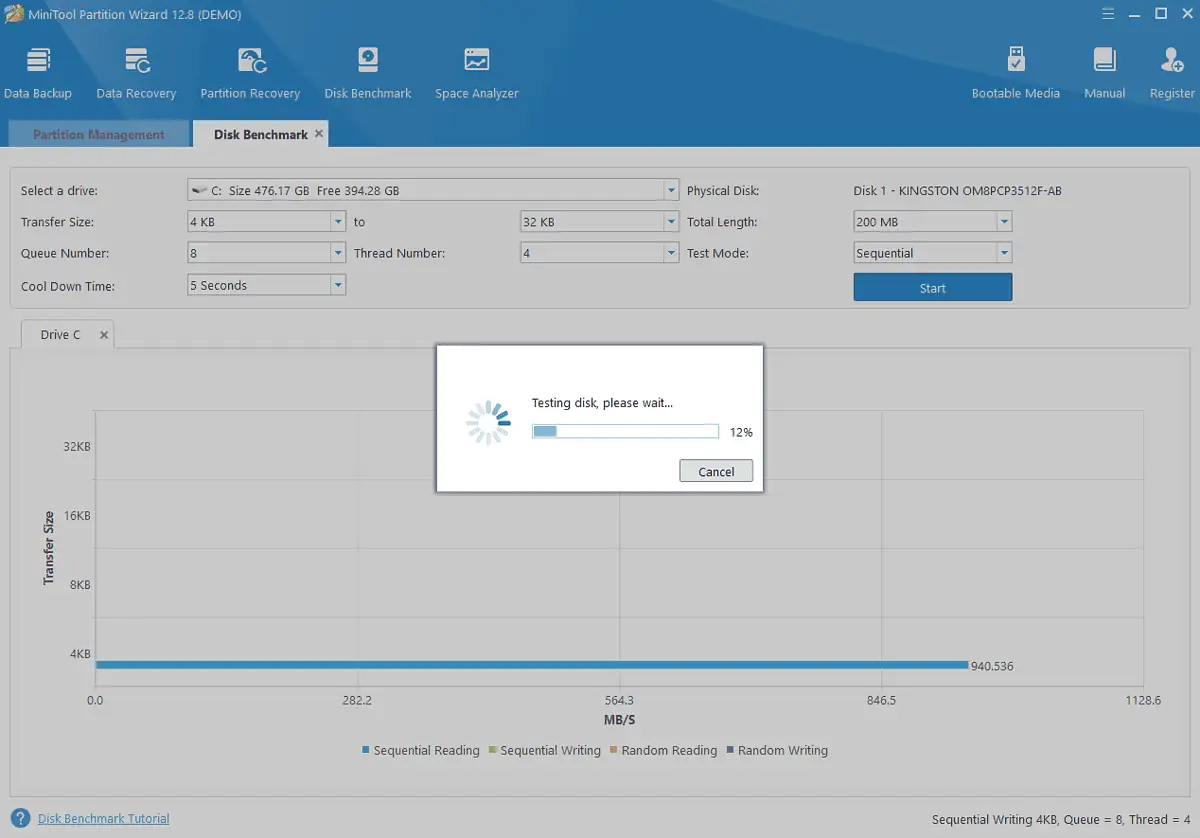
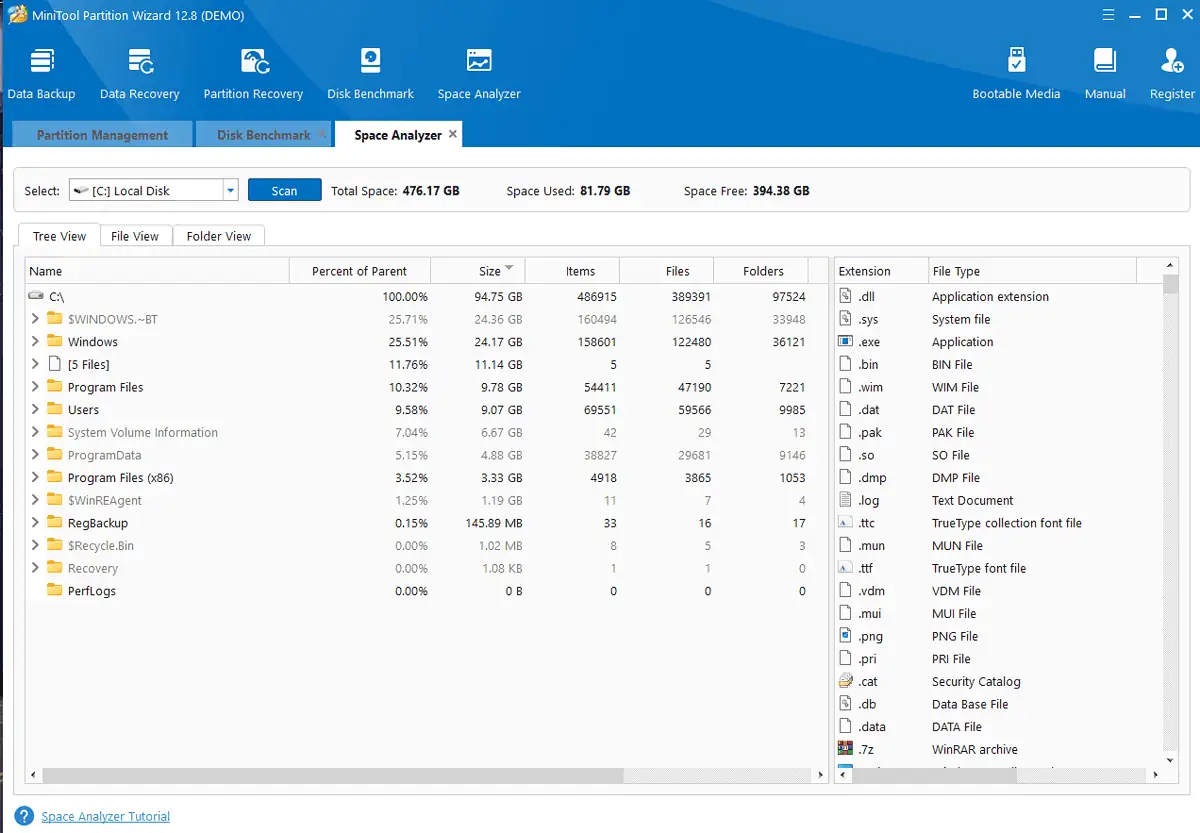
2. MiniTool Partition Wizard
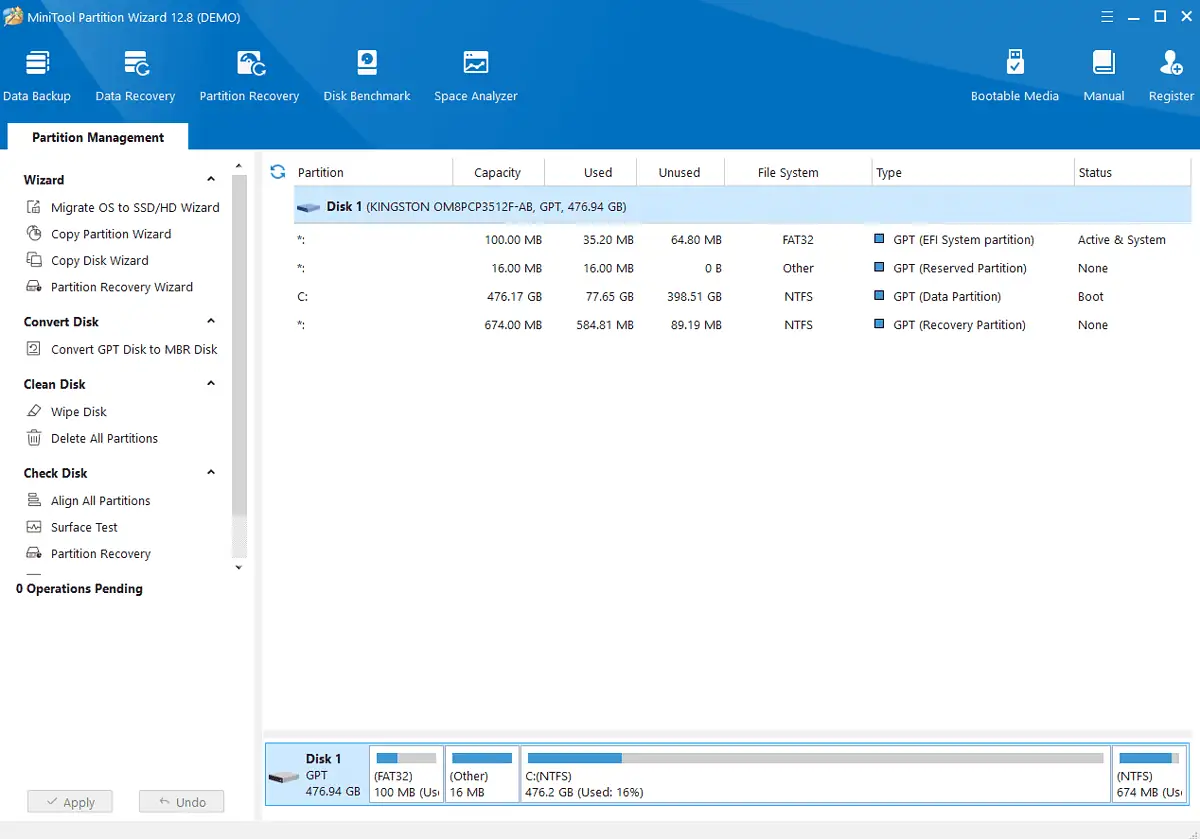
I immediately noticed MiniTool’s well-designed and user-friendly interface.
The software was designed for disk partitioning, and during my testing process, this feature worked flawlessly. I managed to create, delete, and format partitions quickly.
The reason for including it on my list is its analytics feature.

Of course, the information is only limited to disk performance, so it can’t be compared directly with other tools.
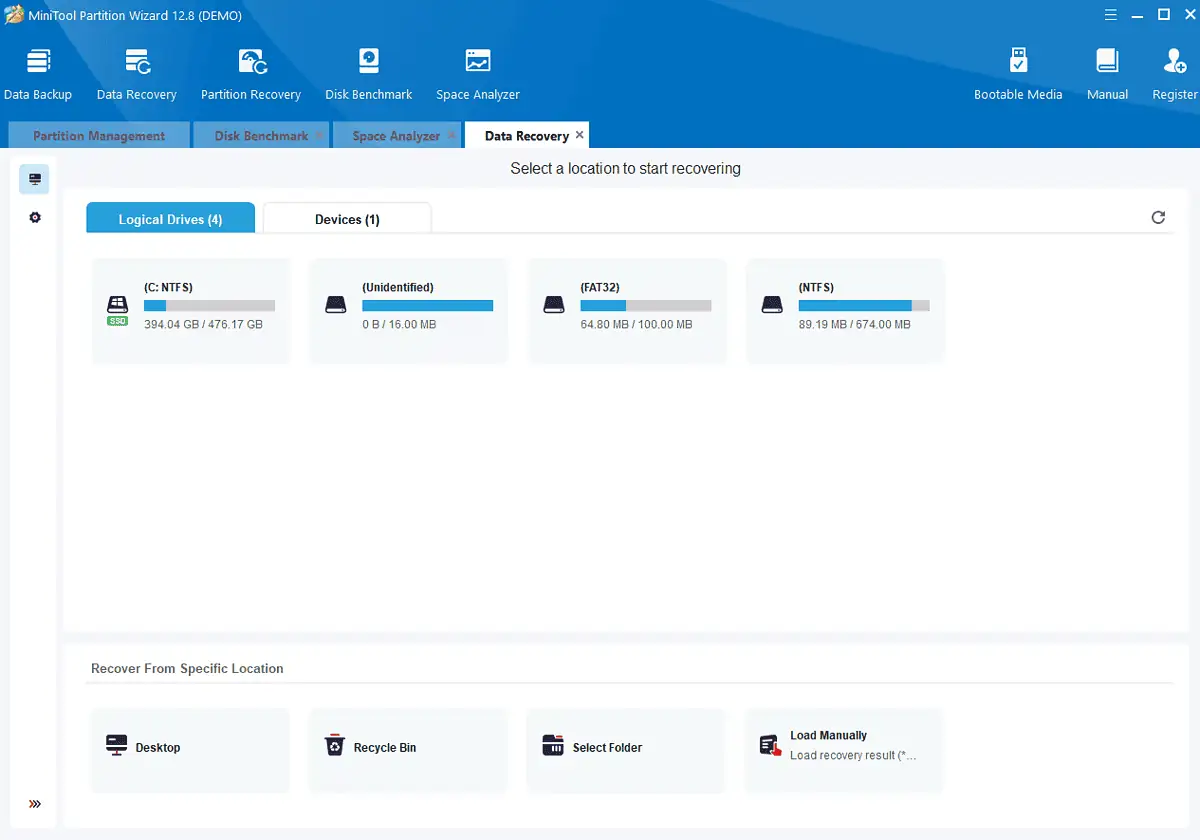
The tool also provides a Data Recovery process.
Still, it lacks specialization in dealing with system resources and hardware data.
Pros:
- The interface is user-friendly and well-designed
- Covers a wide range of partition management functions
- Provides a good data set about disk performance
- The free version is capable
Cons:
- You have to uncheck a box during installation to avoid participating in the Customer Experience Improvement Program
- Pop-ups with promotional messages appeared after the installation
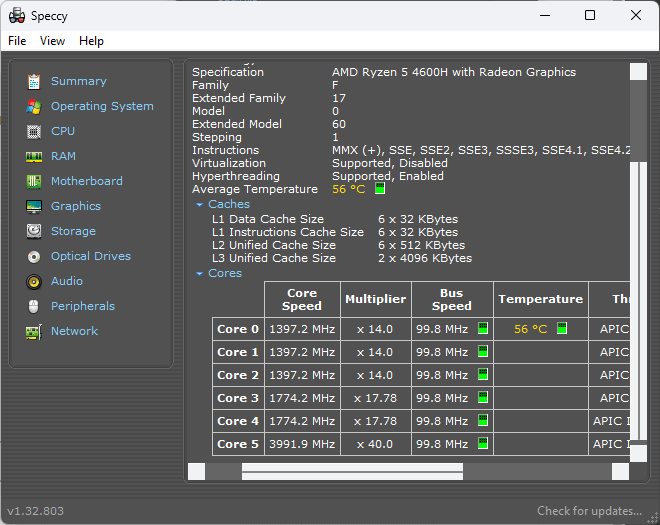
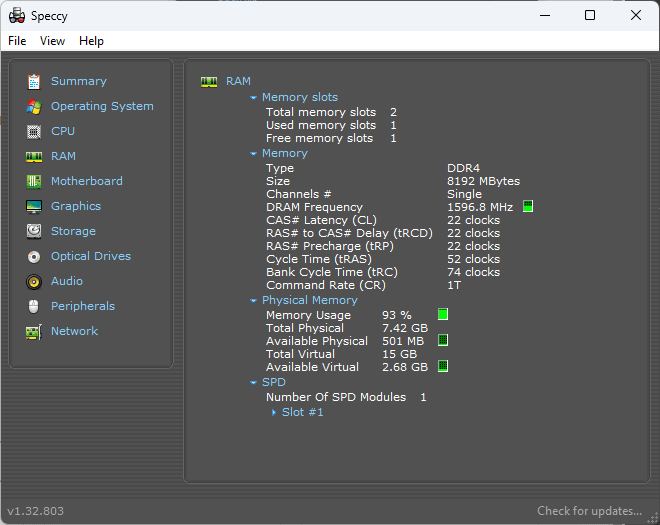
3. Speccy
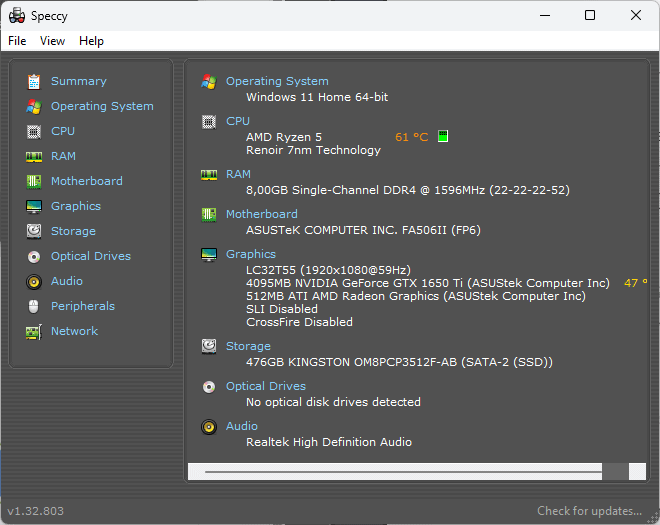
Speccy is a well-known hardware monitoring tool.
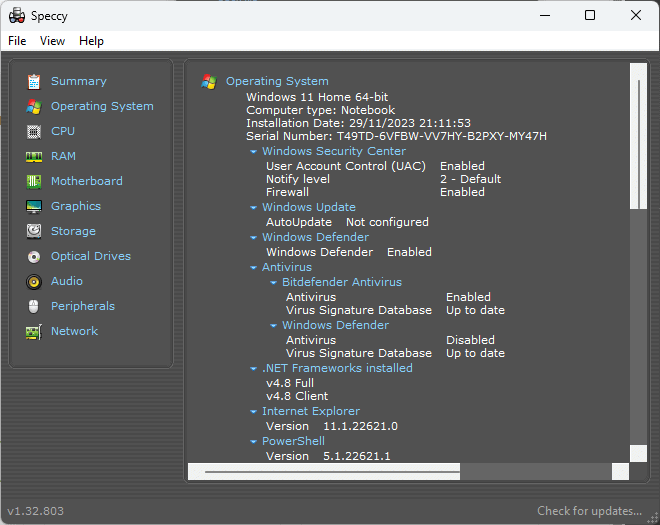
This PC diagnostic tool is completely free to use, providing easy access to a plethora of information about your system. These include the OS (operating system), peripherals, memory, storage, and more.
As I explored the Motherboard, Graphics, Network, and other tabs, Speccy had absolutely no issue presenting real-time information.
It can also create information snapshots. That way, you can export all the data from Speccy to a .TXT file.
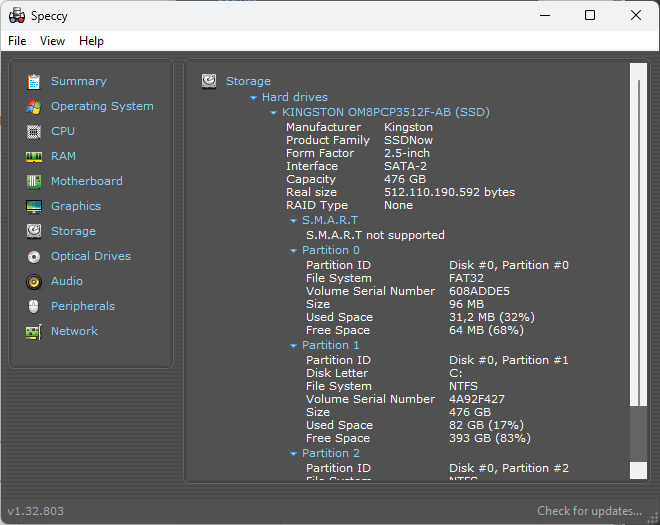
That being said, Speccy lacks some important features compared to other more well-rounded software options.
Pros:
- User-friendly interface with quick access to data
- Provides detailed information on a variety of hardware options
- It can easily export data using a .txt file or the Speccy format
- Absolutely free to use
- It can be downloaded on a device or used as a portable app
Cons:
- Limited features when compared to similar software options
- Updates are less frequent
- I encountered an occasional error when trying to retrieve information
4. HWMonitor Pro
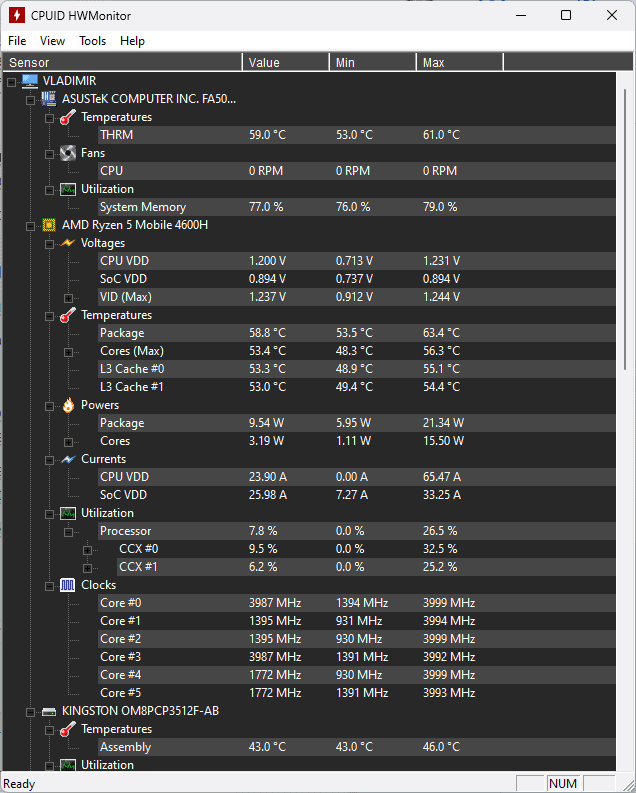
HWMonitor Pro is a user-friendly and capable diagnostic tool. I could quickly reach the options I was looking for by scrolling.
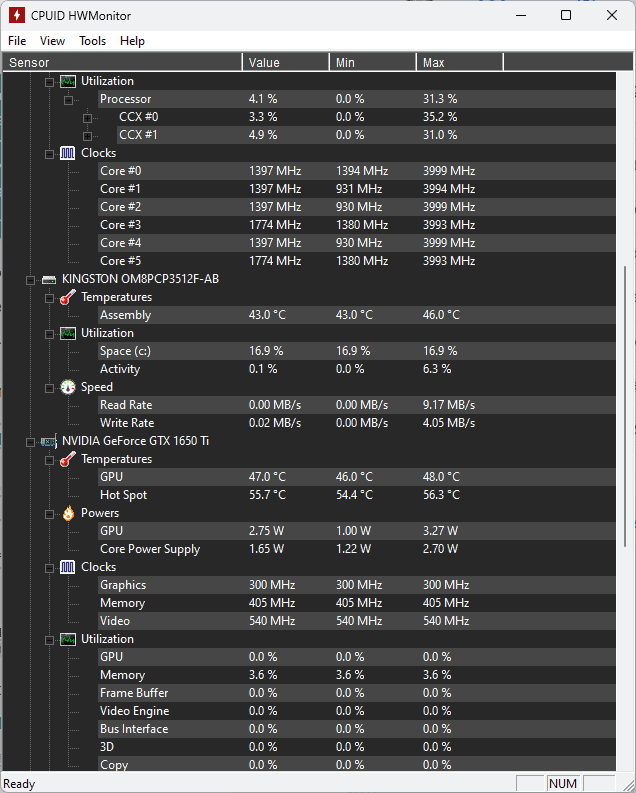
Even the installation took a few seconds so I could access this useful overview instantly.
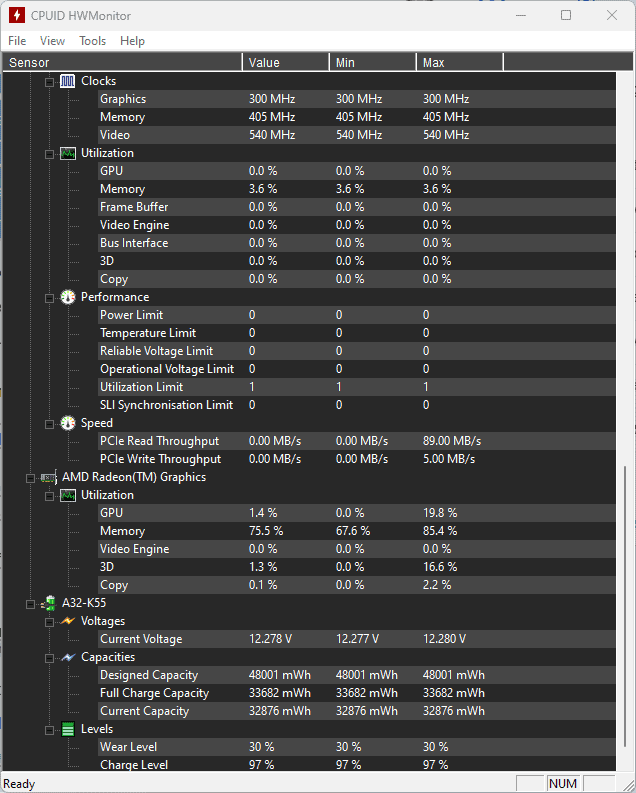
What really made it stand out from the crowd was its capability to keep an eye on my PC’s state remotely.
The online capabilities of this software have also impressed me, allowing you to run detection software efficiently.
I also found that the same tool allows for drive identification.
It scans your device and then offers suggestions to download them from reputable sources. You’ll have to install it separately though.
Seeing the voltages is also useful during the health check process.
Pros:
- Real-time updates on the status of hardware components
- It can be used to monitor any device or set of devices remotely
- The sensor data is presented in real-time
- Easy to use and suitable for all users
- It can be added to a USB storage and used on any PC
Cons:
- The information set provided isn’t as in-depth as other options
- It doesn’t include a built-in set of controls to manage the data
- Doesn’t work on Linux OS
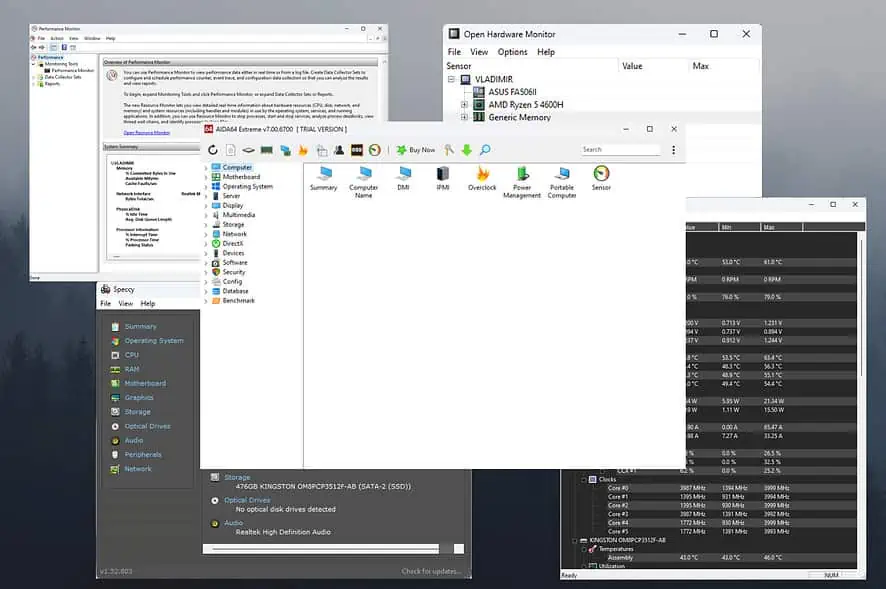
5. Open Hardware Monitor
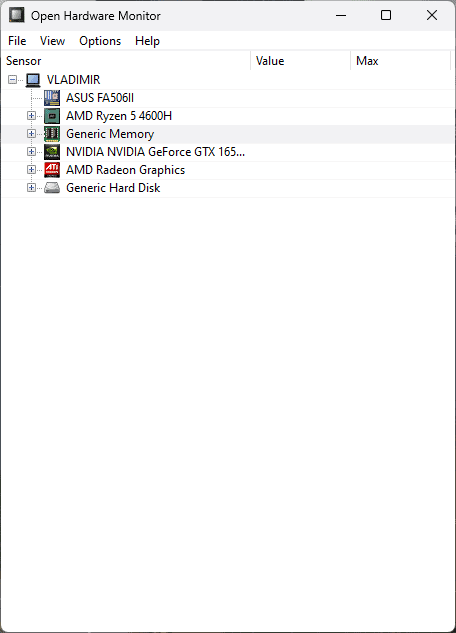
Open Hardware Monitor is another lightweight software you can count on for an accurate hardware diagnostic test.
It was created by the developers at Piriform, which also developed CCleaner.
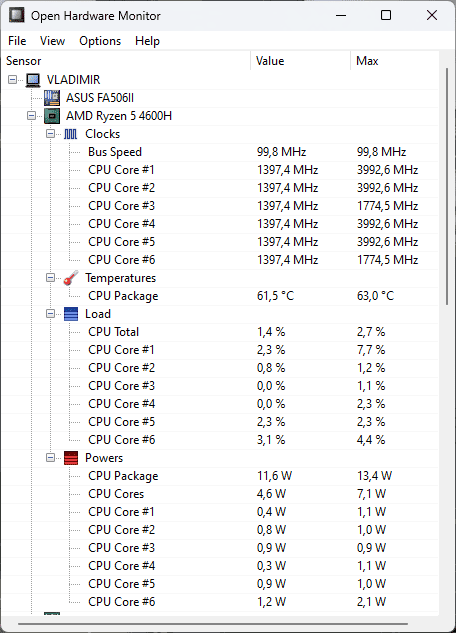
As you can see from the image above, this software provides you with detailed information regarding your CPU. It shows clocks, temperatures, load, and even the power spectrum.
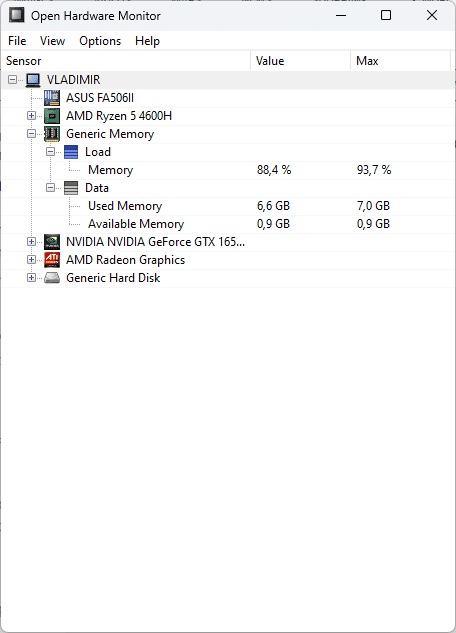
You also get a good overview of your device’s RAM, with clear and real-time usage statistics.
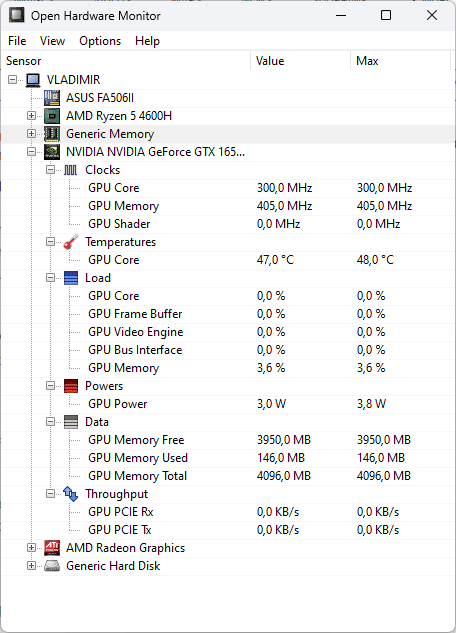
The GPU is also scrutinized by this app down to the last detail.
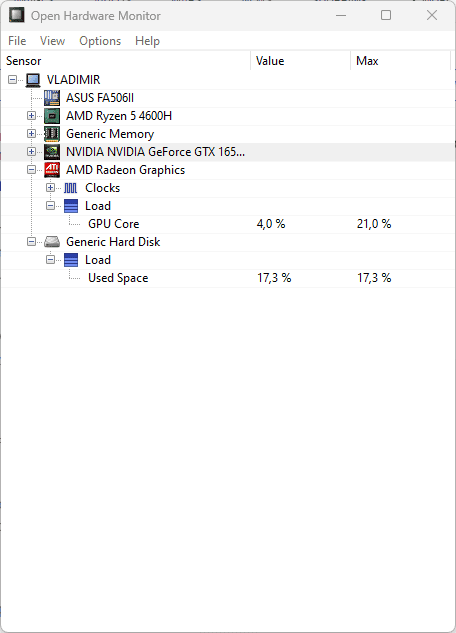
Finally, Open Hardware Monitor covers your HDD as well.
Pros:
- Relatively user-friendly interface with drop-down menus
- Covers the needs of a wide range of diagnostic tools
- It allows you to export data easily
- It can be used both as an installed program or portable
Cons:
- It has limited features compared to other options
- Some users might get lost in the drop-down menu structure
6. Windows Performance Monitor
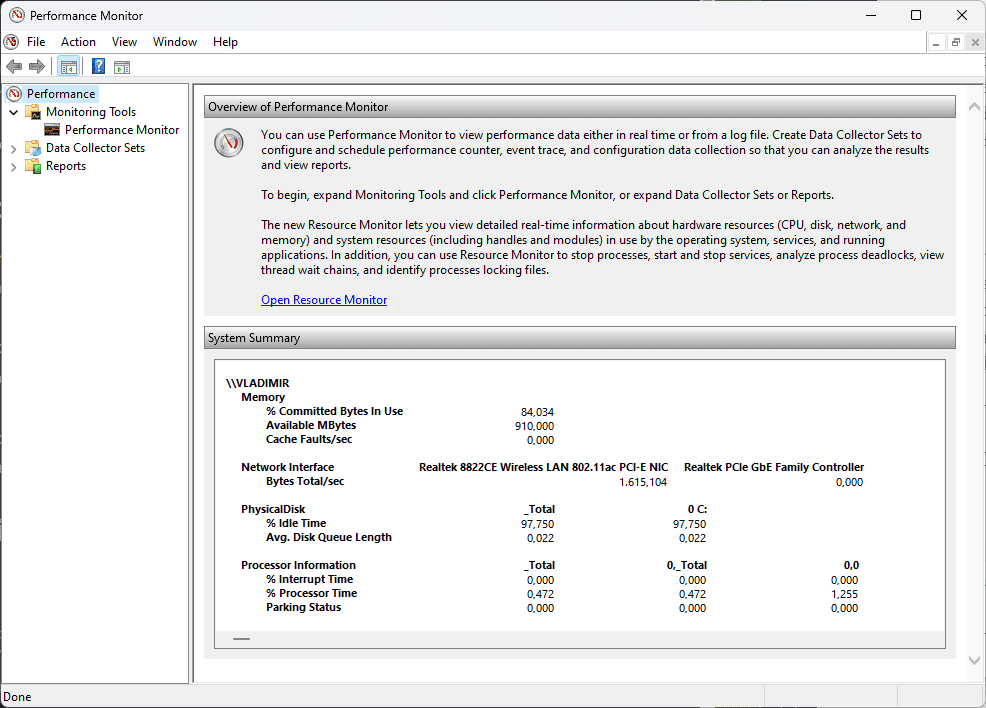
The Windows Performance Monitor is a built-in diagnostic software that provides a helpful overview of your device’s performance. It’s available for Windows 10 and 11.
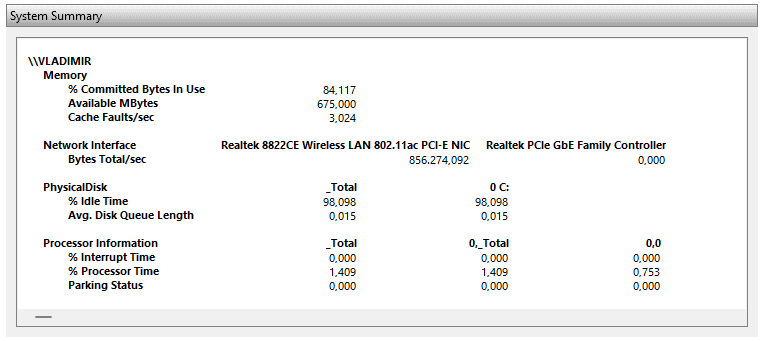
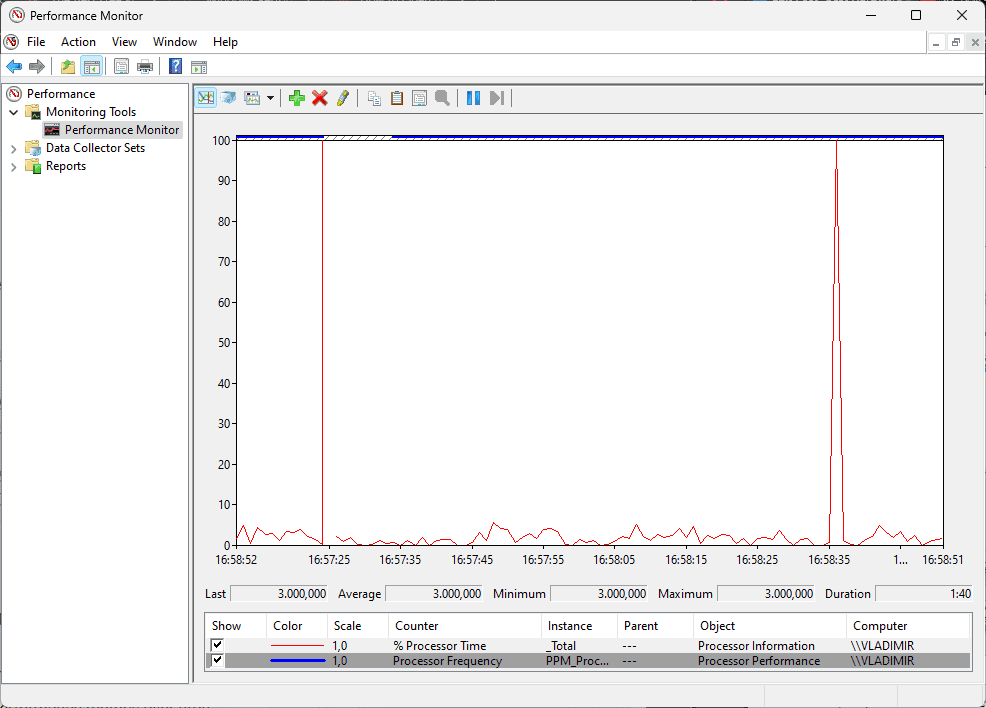
The System Summary section shows you the values of your device’s operations in real-time.
I was quickly able to monitor my system’s memory usage, network usage, disk usage, and more.
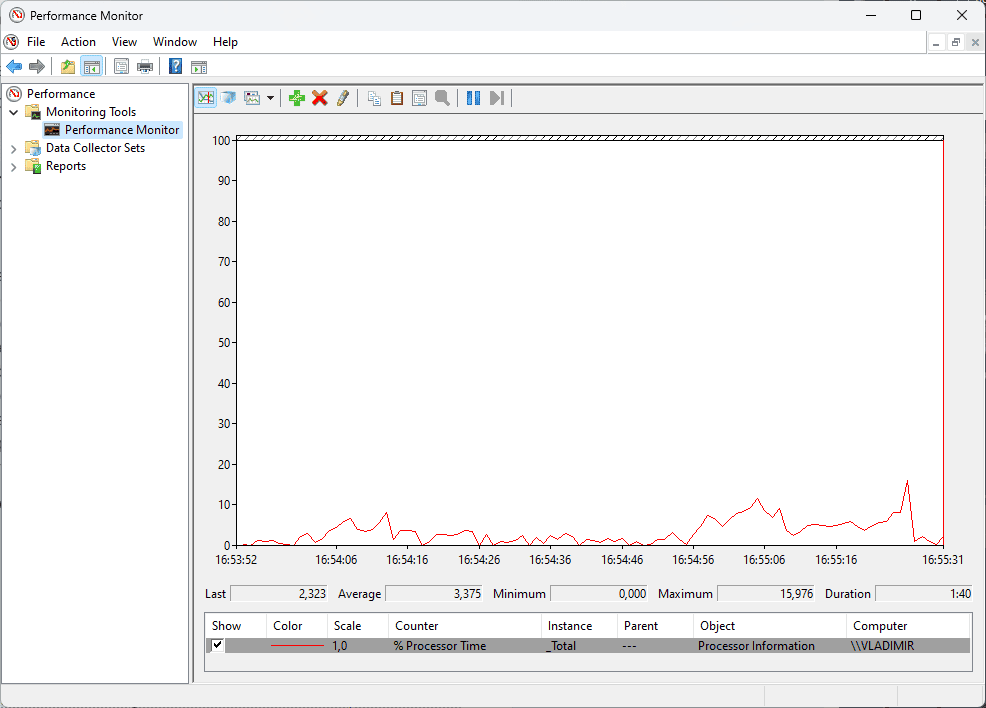
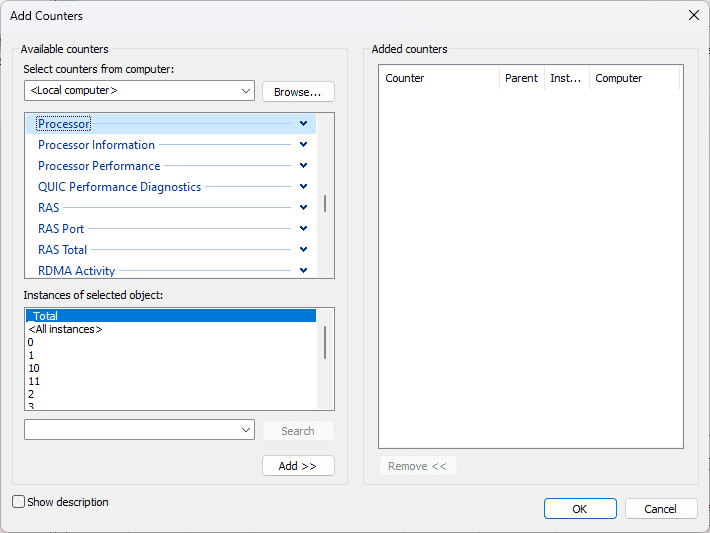
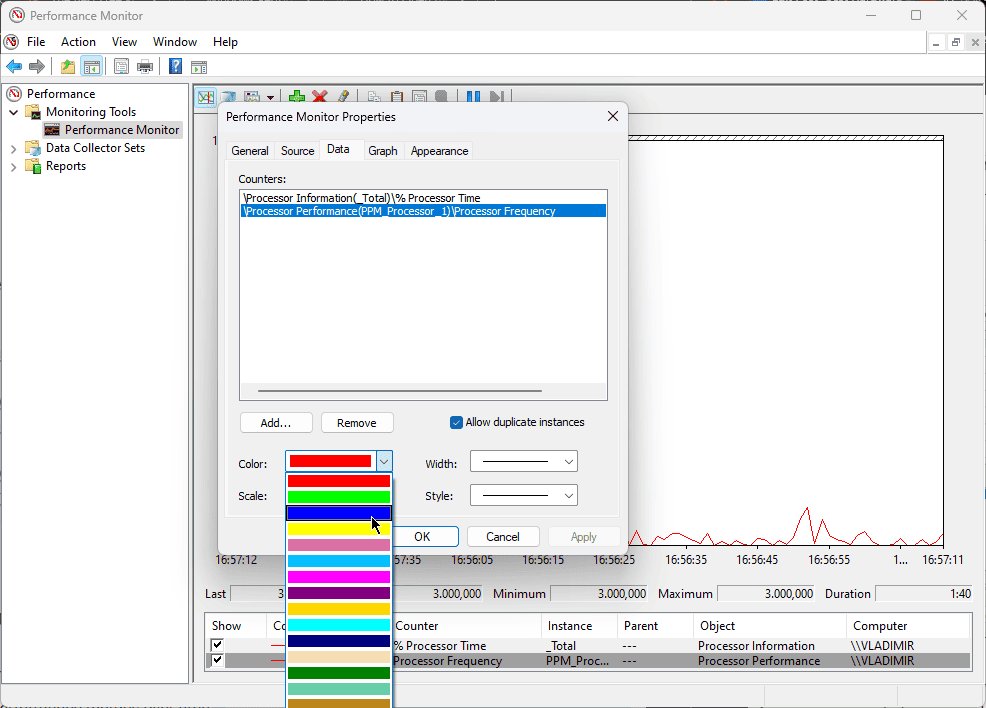
What makes it even more helpful is the fact that I can add other counters to my system performance test. I can do this by clicking the green + (plus) icon from the top of the toolbar.
As you can see, I chose to add a Processor Frequency counter. To easily track the newly added chart, you can change the color and the line’s width and style.
As a result, my added counter will be displayed in the app overview.
You can customize the Data Collector Sets to ensure that the information is tailored to your specific needs.
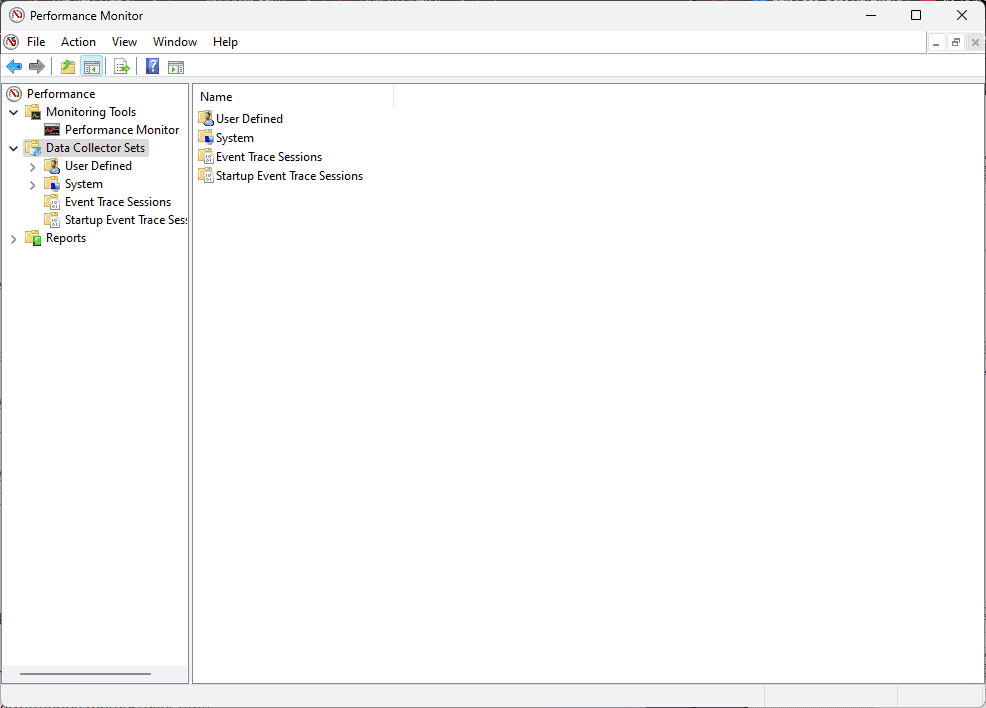
The app can also generate helpful reports, so your information will always be accessible.
Pros:
- Comprehensive monitoring with customization capabilities
- Additional counters can be added covering all aspects of your PC’s activities
- Captures performance metrics over time and in real-time
- The tool is built into Windows, so it is easily accessible
- Can even connect to other computers and perform remote monitoring
Cons:
- The interface can be overwhelming for beginners
- It only works on Windows devices
7. CPU-Z
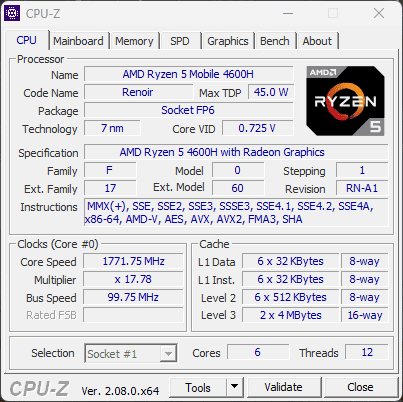
As the name suggests, CPU-Z is a handy tool that measures the processes related to your CPU (processor). It’s also a reliable motherboard diagnostic tool.
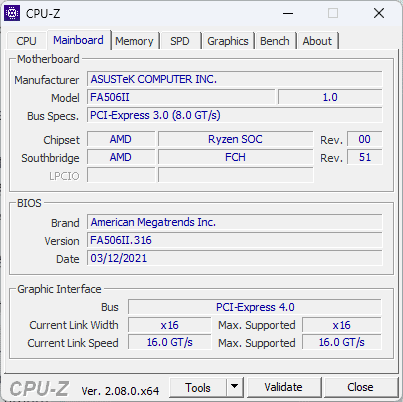
Moreover, you can get information about how your other hardware performs, down to the tiniest details.
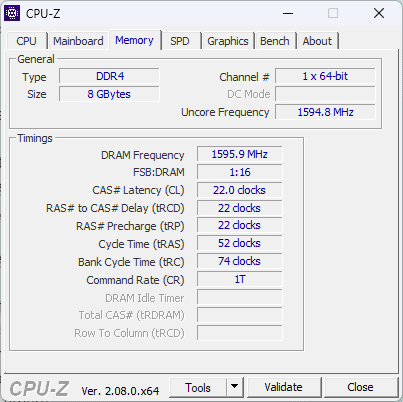
This freeware software provides real-time measurements of each core’s performance and even the frequency for memory.
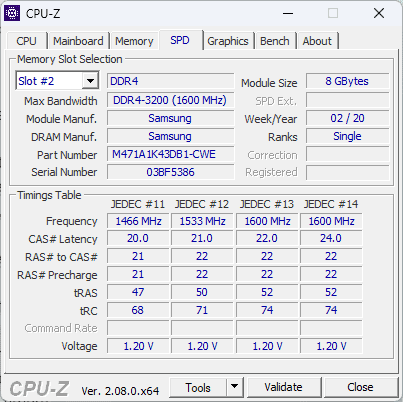
I found details about my PC’s CPU core clocks and speeds, motherboard, and others.
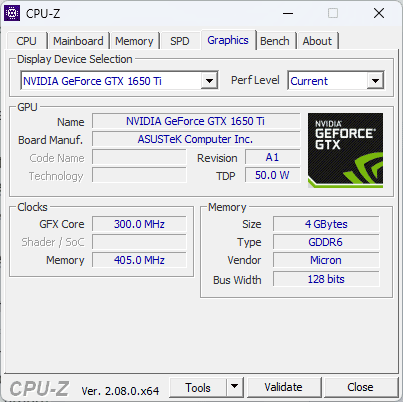
What’s more, I could test for system malfunctions and ensure stability is maintained.
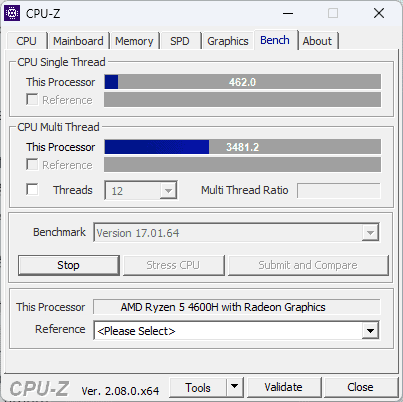
This can be done using benchmarks, stress tests, and timers.
Pros:
- Comprehensive monitoring features
- Simple and user-friendly interface
- Includes benchmarking and stress tests for system performance
- Provides in-depth reports about the PC’s hardware
Cons:
- Interface design is antiquated
- The depth of analysis for some hardware is limited
- It doesn’t include any control options for the data that’s been recorded
- It only works on Windows-based devices
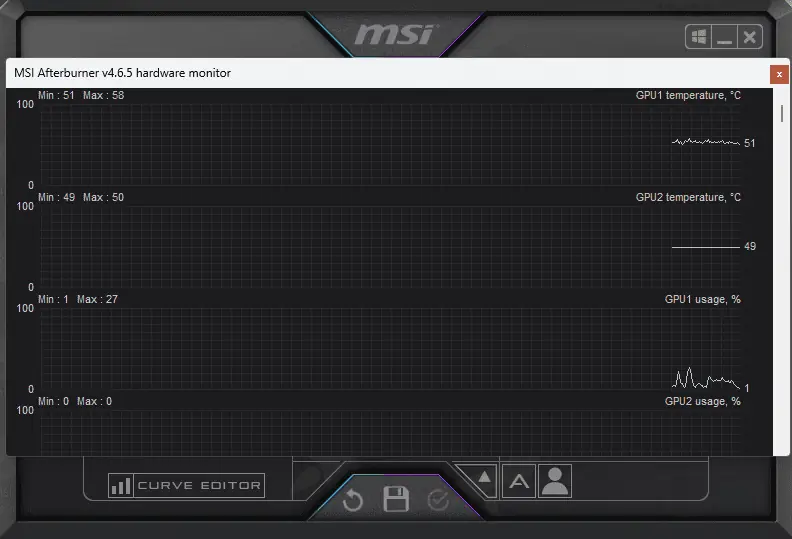
8. MSI Afterburner
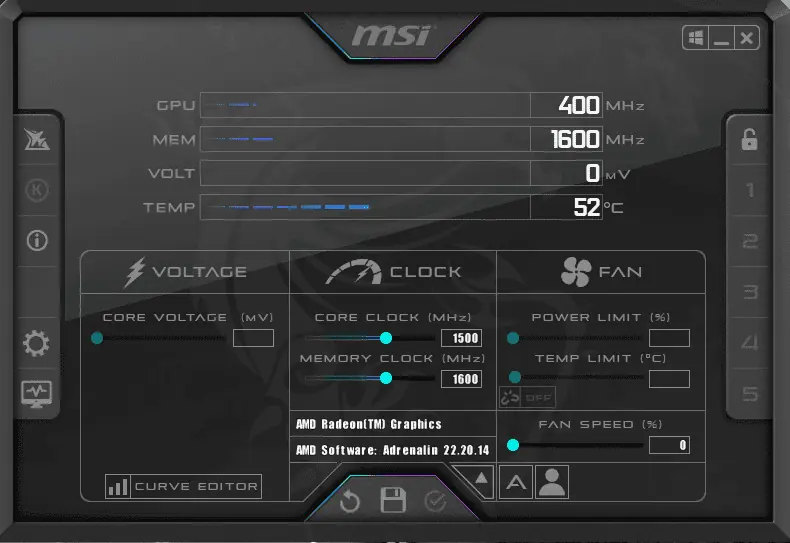
MSI Afterburner is a comprehensive GPU system controller that allows users to overclock their systems and manage their GPU.
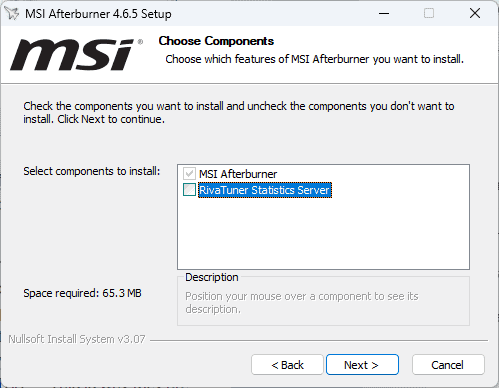
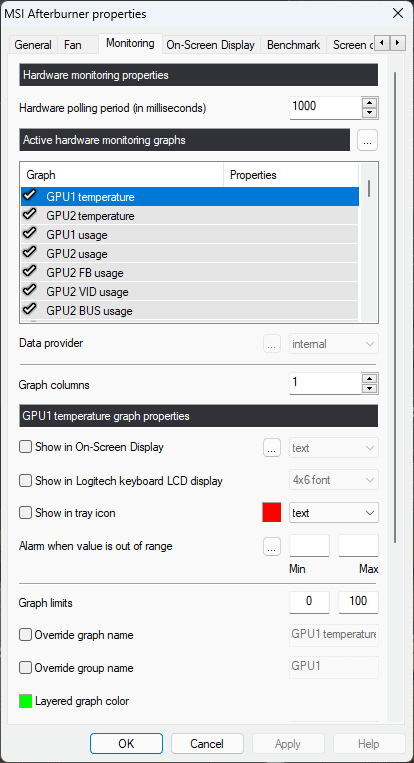
You can also access the RivaTuner Statistics Server, which is specifically designed for gamers. This tiny bundled app is a frame-rate monitoring tool and a video capture service. To avoid installing this element, you can untick the box at installation (see image below).
The MSI Afterburner application lets you quickly adjust the GPU’s clock frequency, voltage, memory clock, and even GPU temperature limit.
What I really liked when testing this software was the OC Scanner tool. It helps you determine the highest stable overclock setting your system can manage.
This ensures you can overclock your GPU without worrying about affecting system stability.
Pros:
- A versatile tool that offers valuable information besides overclocking GPU
- Automatically employs the OC Scanner for stable overclocking
- Easy-to-use interface with a modern futuristic design
- It is not limited to MSI products
- Free to use
Cons:
- The installation process comes bundled with the RivaTuner Statistics Server
- Gameplay capture can be spotty
- The interface can be confusing for first-time users
- It only shows data points like temperature, voltages, and frequencies
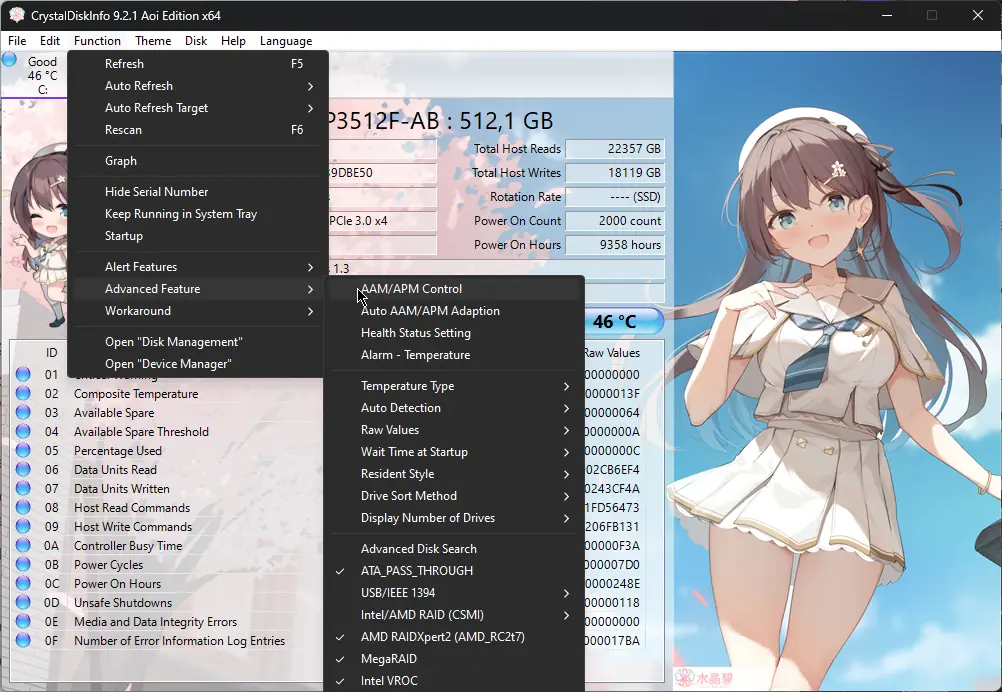
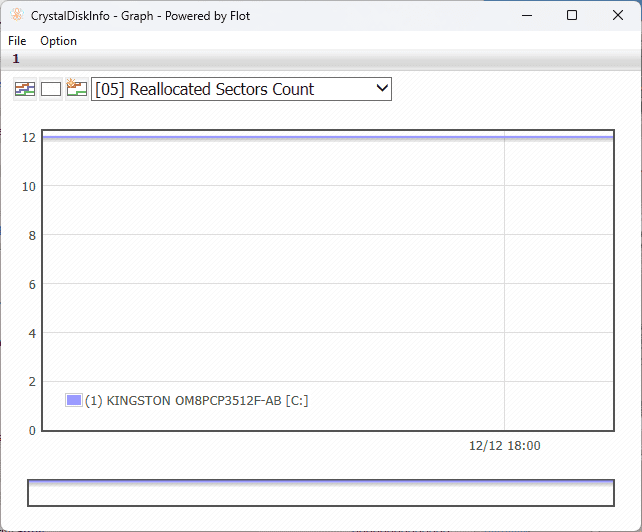
9. CrystalDiskInfo
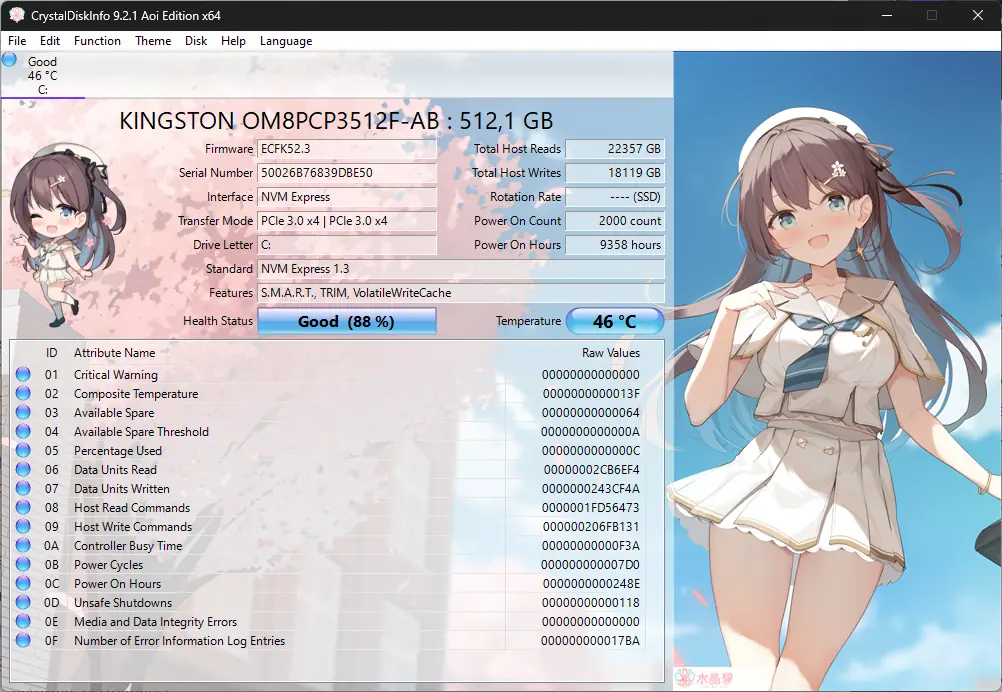
CrystalDiskInfo, even with its unusual anime-inspired design, has proven to be a versatile hardware monitoring tool. It runs perfectly on any Windows version.
This tiny utility, which also supports USB, Intel RAID, and NVMe, offers a quick overview of real-time data about your device. Unfortunately, it’s only limited to information about the hard disk.
That said, it covers details like drive temperature, number of failed and read or write attempts, how long the drive has been running, and how regularly it has been started and stopped.
The real-time monitoring allows the software to send alerts whenever any factor approaches a dangerous threshold. If this happens, I recommend you create HDD backups immediately.
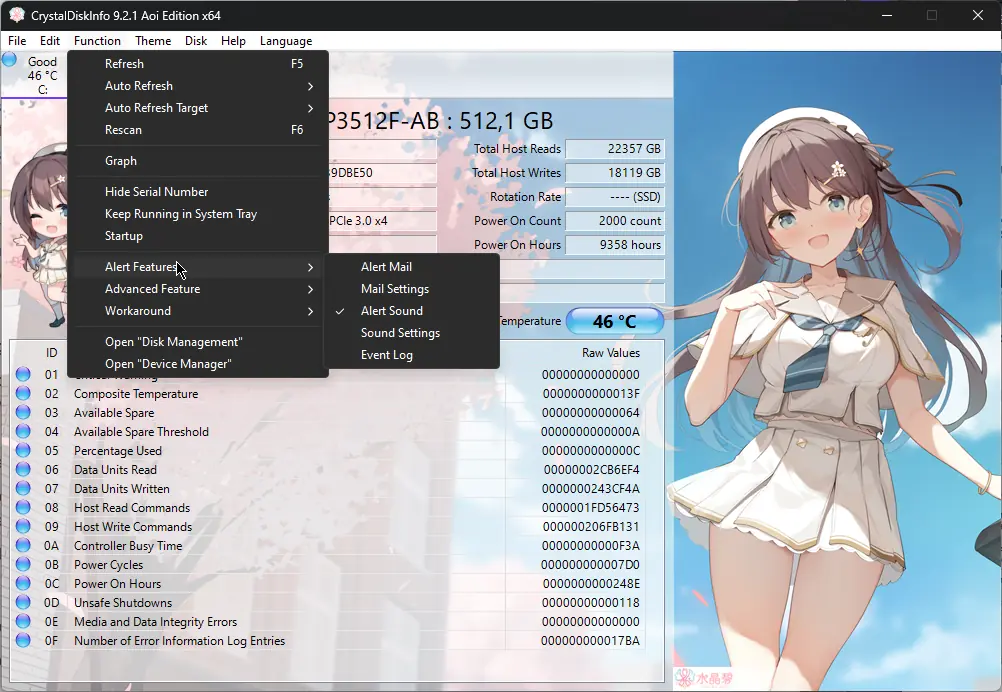
Besides the limited hardware information it provides, CrystalDiskInfo isn’t very clear when it comes to the explanation of specific values.
Pros:
- Easy to navigate and understand for experienced users
- Provides a wealth of information about hardware performance
- Includes an alert system for various factors
- Supports a variety of devices, including USB, Intel RAID, and NVMe
- Free to use
Cons:
- The explanation of the data is very limited, making it unsuitable for beginners
- Lacks advanced hardware monitoring capabilities
- It doesn’t include control options for the data it provides
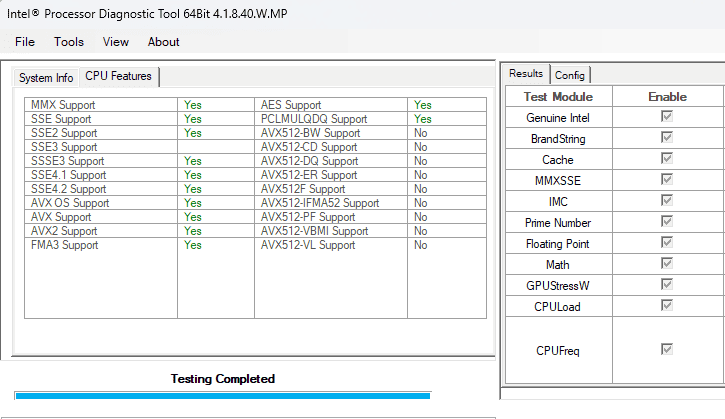
10. Intel Processor Diagnostic Tool (IPDT)
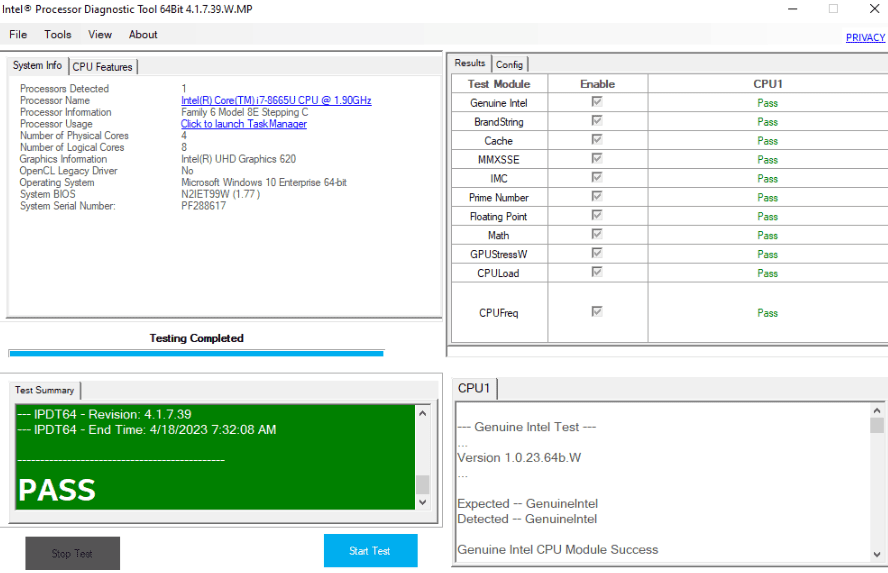
Installing the Intel Processor Diagnostic Tool took about 10 seconds, and the interface above was presented.
As you can see, this tool is designed specifically for devices with Intel processors. It allows you to customize the way your CPU and GPU (video card) work and also to verify the safety of these devices.
Simply click the Start Test button. This will initiate the scanning processes, and you’ll see the results list on the right-side screen.
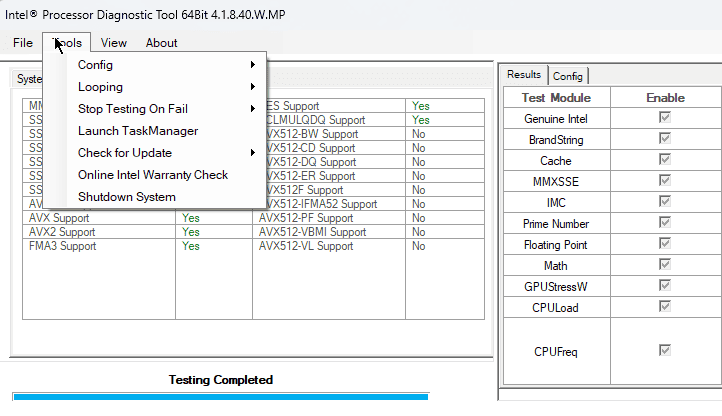
Furthermore, the app lets you quickly check for updates, modify settings, and shut down your system.
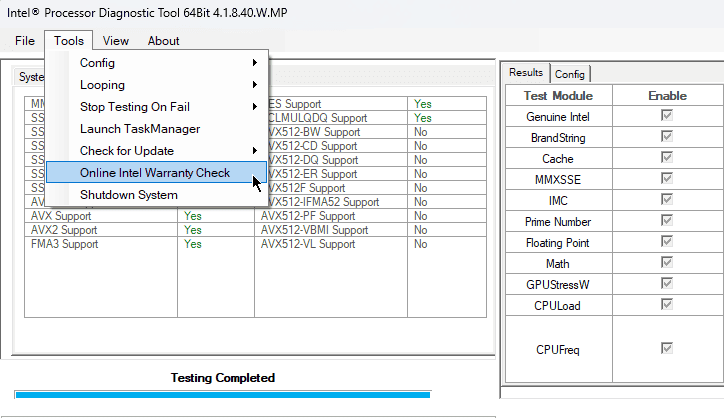
The Only Intel Warranty Check is also handy for your PC, ensuring all your hardware passes the warranty check.
Best of all, this tool has a very low impact on system resources.
Pros
- Begins the scanning process automatically
- Identifies any Intel hardware and scans for issues
- Includes CPU operating frequency and a stress test
- Reliable in detecting errors and issues with Intel hardware
Cons:
- It only works for Intel hardware
- It has limited usage
You may also be interested in:
- 8 Ways To Fix The Request Failed Due To A Fatal Device Hardware Error
- Best Windows Troubleshooting Tools
How To Use Hardware Diagnostic Tool
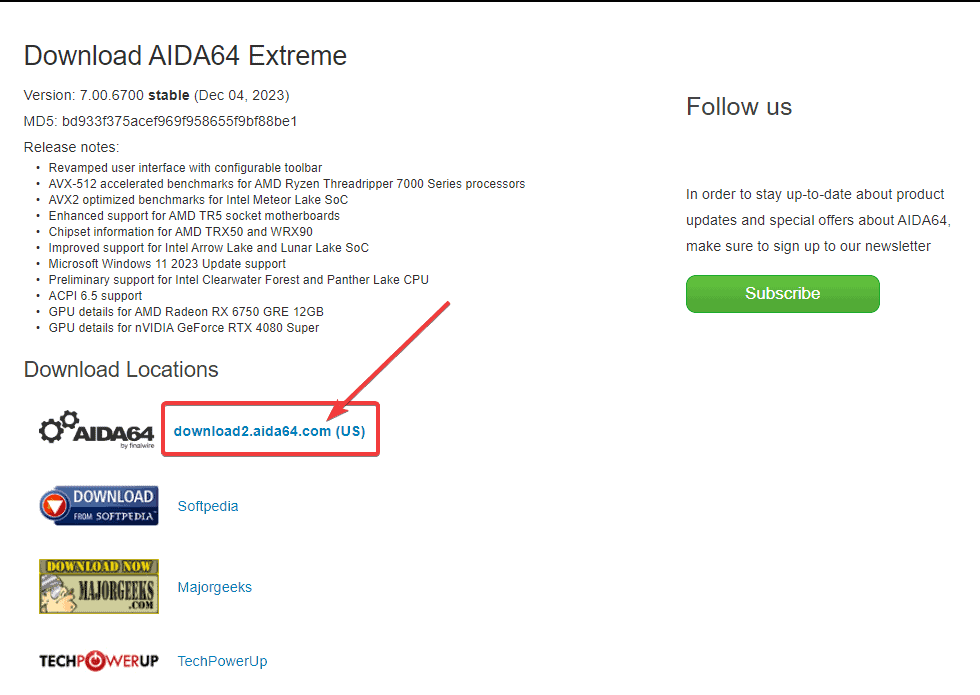
- Download and install the AIDA64 Extreme app from the official source.
- Run the software by double-clicking the executable file from the installation location.

- Depending on your needs, navigate the interface, and check system hardware information.
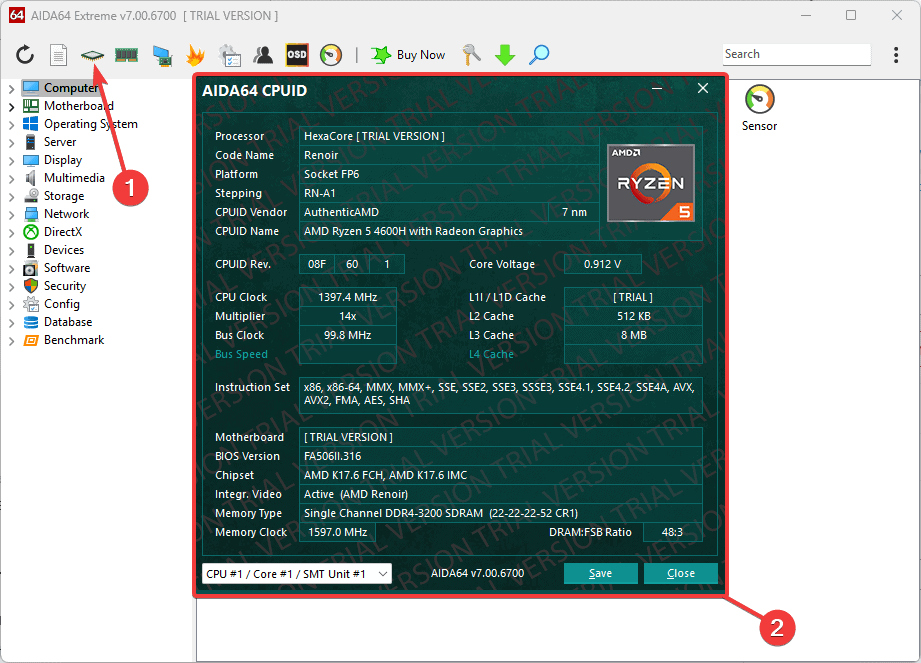
- Click the AIDA64 CPUID option from the toolbar to see an overview of the CPU information.
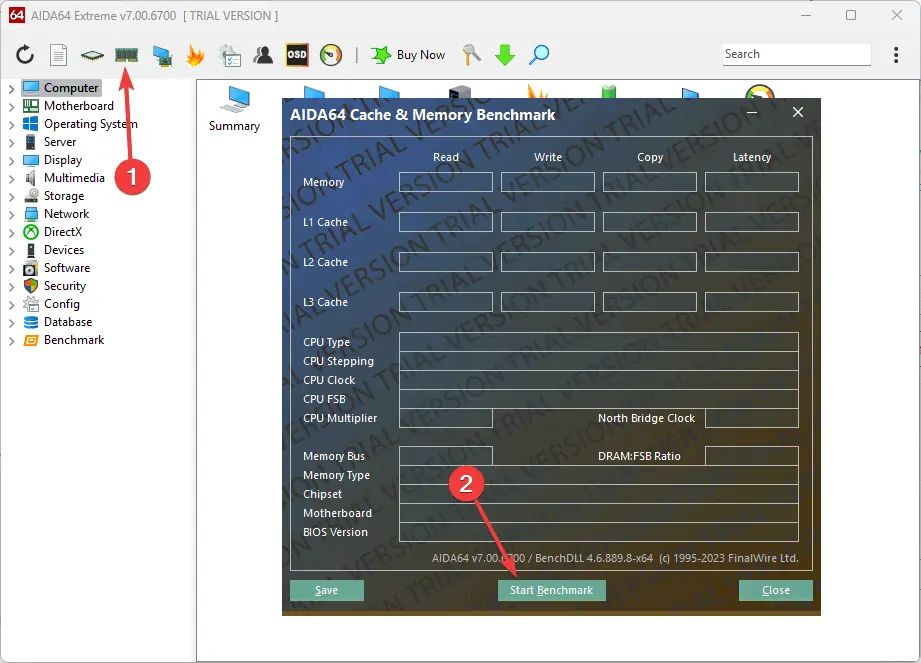
- Run the Cache & Memory Benchmark from the toolbar.
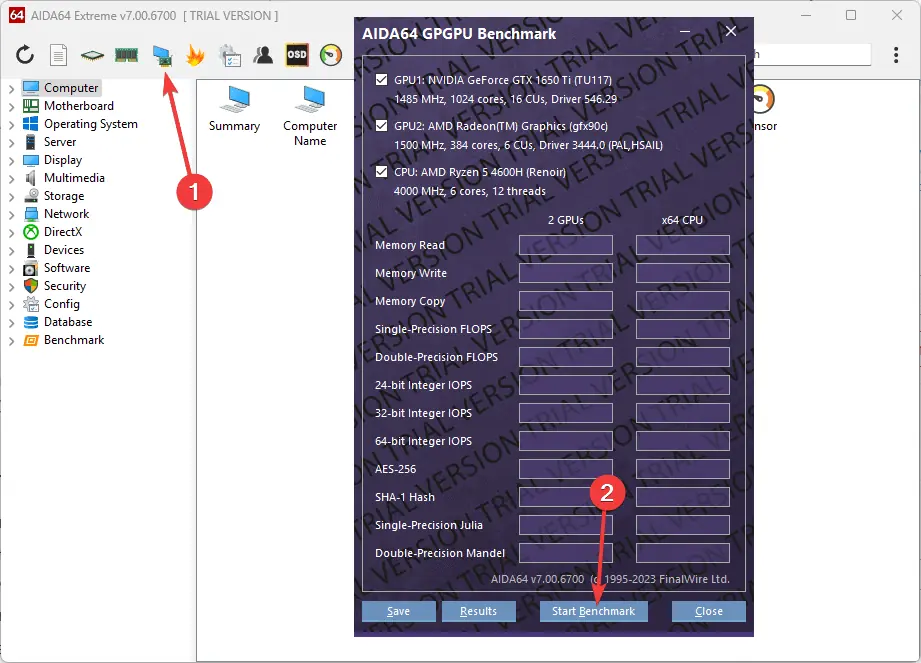
- Run the GPU Benchmark to collect data about your PC’s GPU.
- Run the System Stability Test to check your device’s state.
- Use the left-side list to navigate between your computer’s hardware options and read the collected information.
So, now you know what to look for when browsing for the best hardware diagnostic tool.
Whether you’re a novice or a seasoned tech enthusiast, these PC hardware diagnostic tools will meet your requirements. Make sure to download it from official sources and run an antivirus scan afterward to ensure your PC’s safety.
Read our disclosure page to find out how can you help MSPoweruser sustain the editorial team Read more


Improve this guide


User forum
0 messages