Microsoft releases 3 new Power BI Custom Visuals for analyzing collections of text
![]() 2 min. read
2 min. read
![]() Published on
Published on
Share this article

Improve this guide
Readers help support MSpoweruser. We may get a commission if you buy through our links.

Read our disclosure page to find out how can you help MSPoweruser sustain the editorial team Read more
Microsoft yesterday released 3 new custom visuals for Power BI. The strippets browser, cluster map, and facet key are designed to help you create Power BI solutions for browsing, understanding, analyzing large collections of text.
- The Strippets Browser is a document reader that provides two complementary ways of sampling the contents of a collection of documents or a news stream. The first unwraps each story into a thumbnail that reveals the source, headline, and leading text and image of the story. Using the thumbnails view, the reader can scroll through a list or grid or thumbnails to quickly grasp the topic of each story in the collection. Clicking on a thumbnail activates a reading mode in which the full document contents can be read in context.
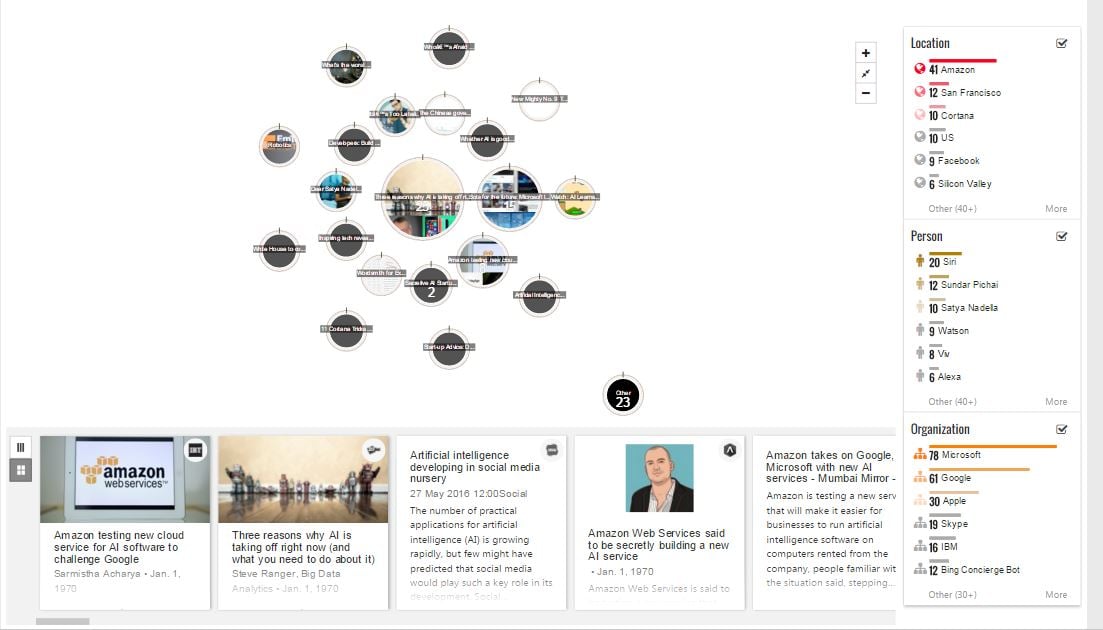
- Even with the reading efficiency of Strippets Browser, sometimes you might just want to focus on a particular topic, or see the range of topics in a document collection before deciding where to start. Enter the Cluster Map, which displays clusters of related documents in an expressive image mosaic. Clusters can be arranged in a symmetric “spiral” layout or a more freeform “relational” layout, with cluster proximity in the latter case determined by the relatedness between clusters. Selecting a cluster in either layout can filter and highlight stories in Strippets Browser when both are used in the same report
- The Facet Key is the final piece for putting together a great document analysis report, showing the most frequent entities of various types across an entire document collection. Selecting an entity of interest filters and highlights linked visuals in ways that enable document collections to be analyzed systematically, one entity at a time. When a Facet Key is used in the same report as a Cluster Map, entity selections trigger blue highlight arcs around clusters representing the proportion of clustered documents containing references to that entity. Clusters containing no references are also faded out for contrast:
You can download these custom visuals from the Visuals Gallery. Read about these visuals in detail here.